
Rapid demand growth is colliding with rising infrastructure costs, long resource-development timelines, affordability pressures, and the continued need to decarbonize the power system. This study evaluates how ambitious but feasible adoption of distributed energy resources (DERs) could address these challenges and deliver over half a trillion dollars in cost savings to the grid and customers over the next 25 years.
Prepared by
Read the Full Report
Read the Technical Appendix
The National Case for a More Distributed Power Grid:
New Evidence on Affordability and Demand Growth
Prepared FOR

We evaluate the impacts on the US power system through 2050 under a scenario in which DER deployment expands nationwide to levels already observed in leading US markets. Two of Brattle’s system planning models – FLEX and gridSIM – are the analytical engines for the analysis.
Study Methodology
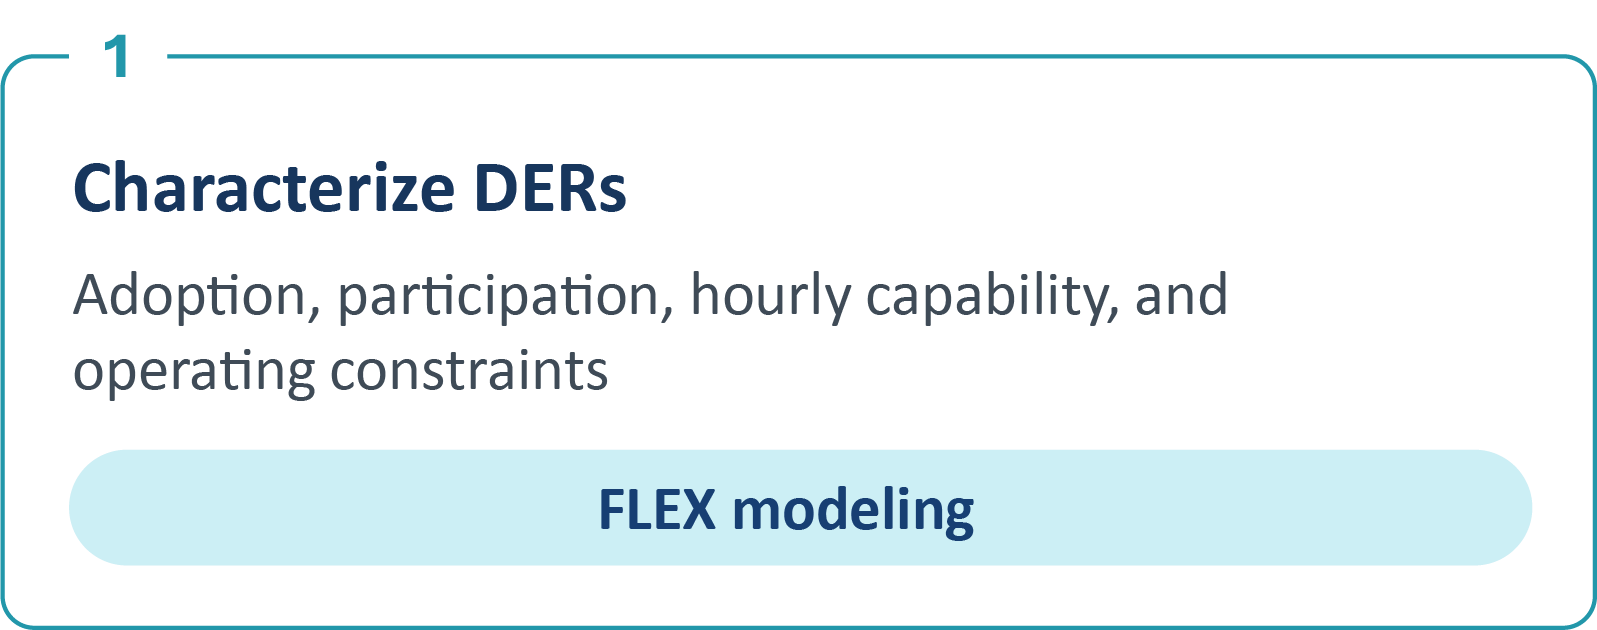
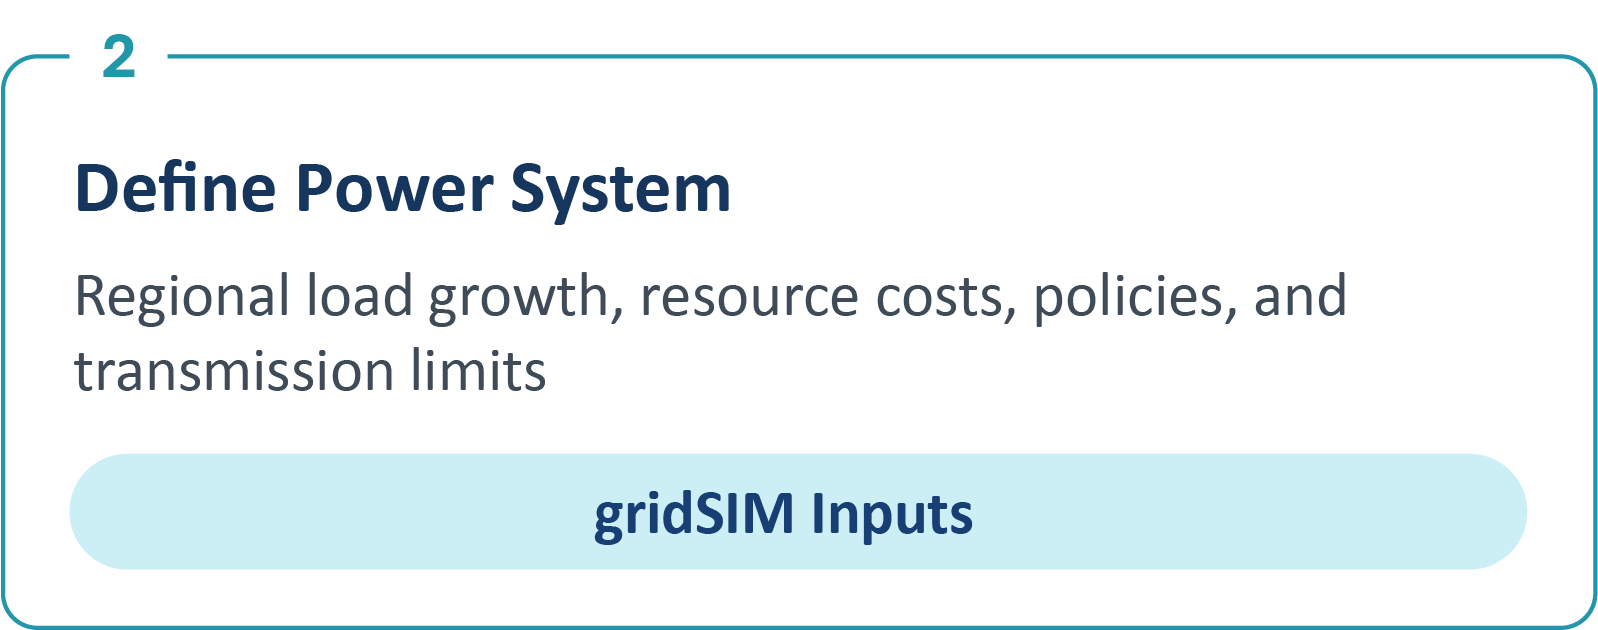
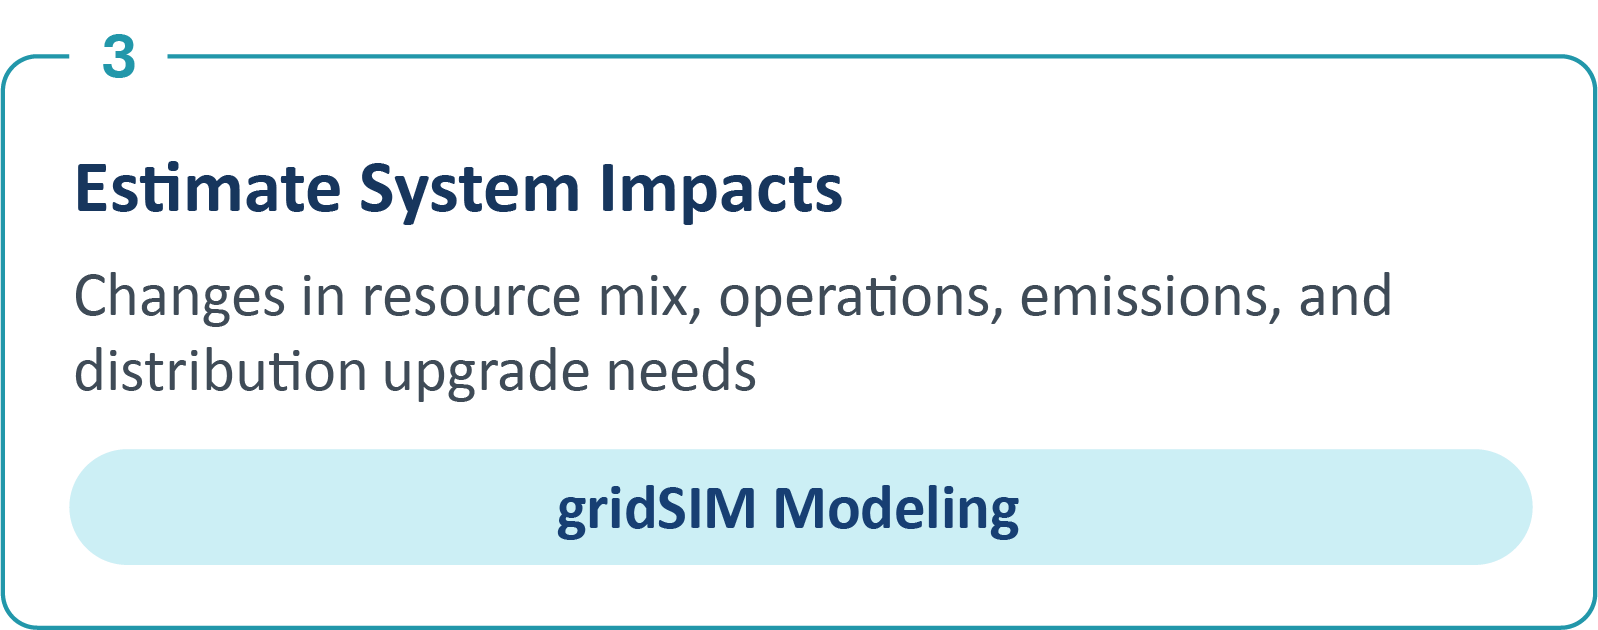
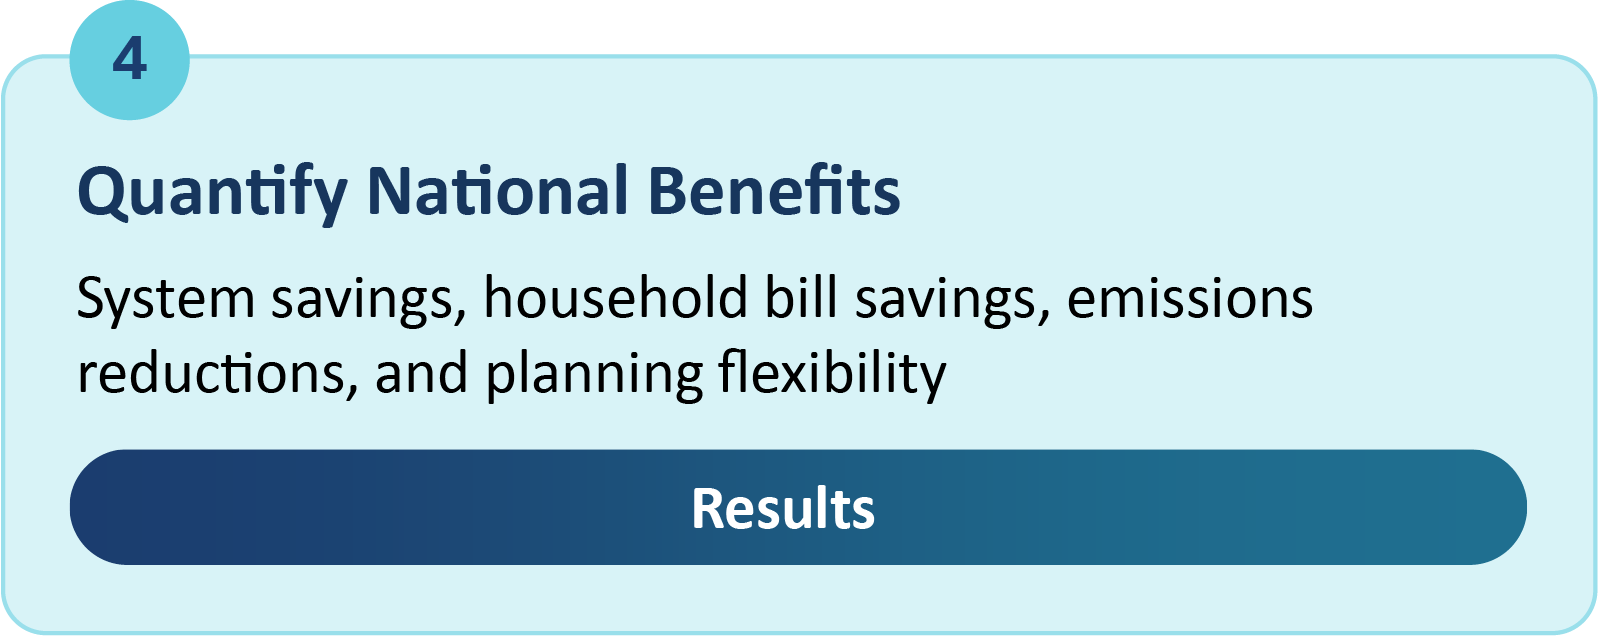
This growth would make DERs the fourth-largest resource in the US capacity mix, with about 400 GW of additions – the equivalent of nearly one-third of the country’s entire power generation fleet today.
DER nameplate capacity could feasibly grow from 8% of US installed capacity today to 18% by 2050.
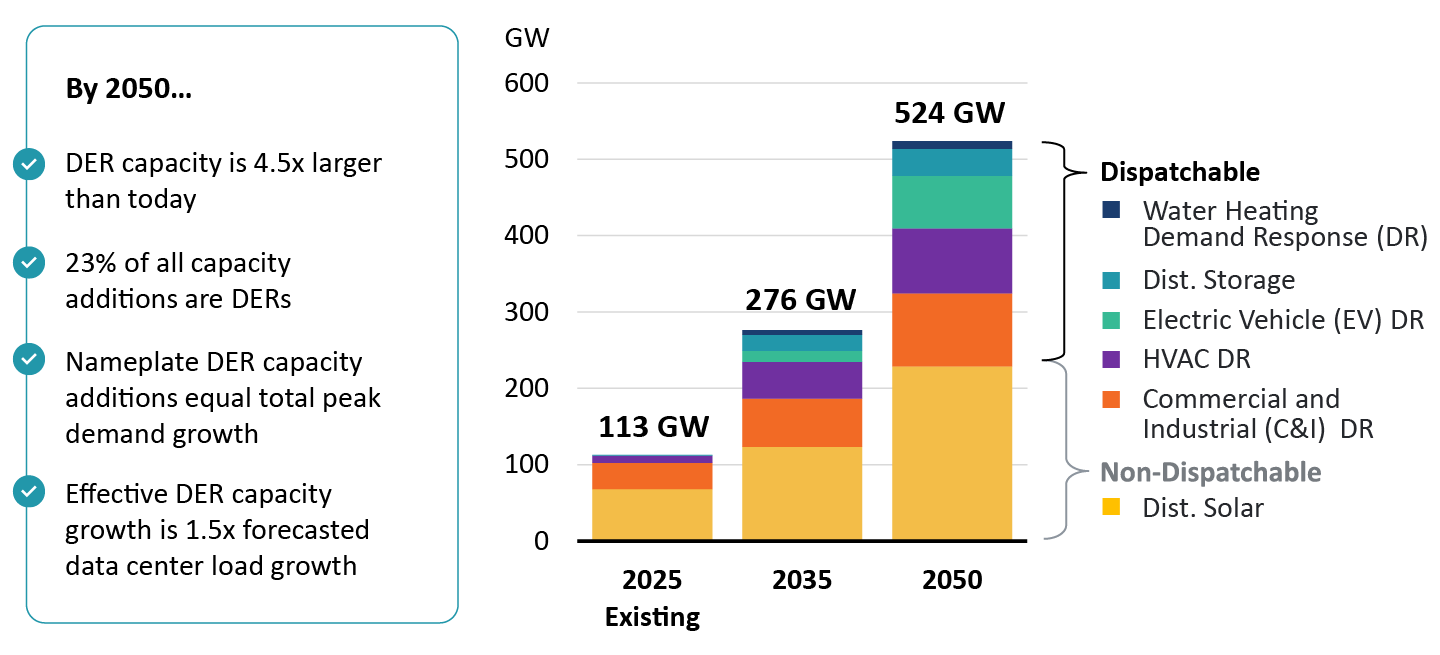
Note: Growth drivers include 1-in-6 single-family homes with rooftop solar, 15–45% customer participation in flexible load offerings (varies by offering), 21% of all storage additions are distributed, and additional front-of-meter solar and commercial and industrial (C&I) flexibility.
Figure 1: US DER Installed Capacity (Nameplate)
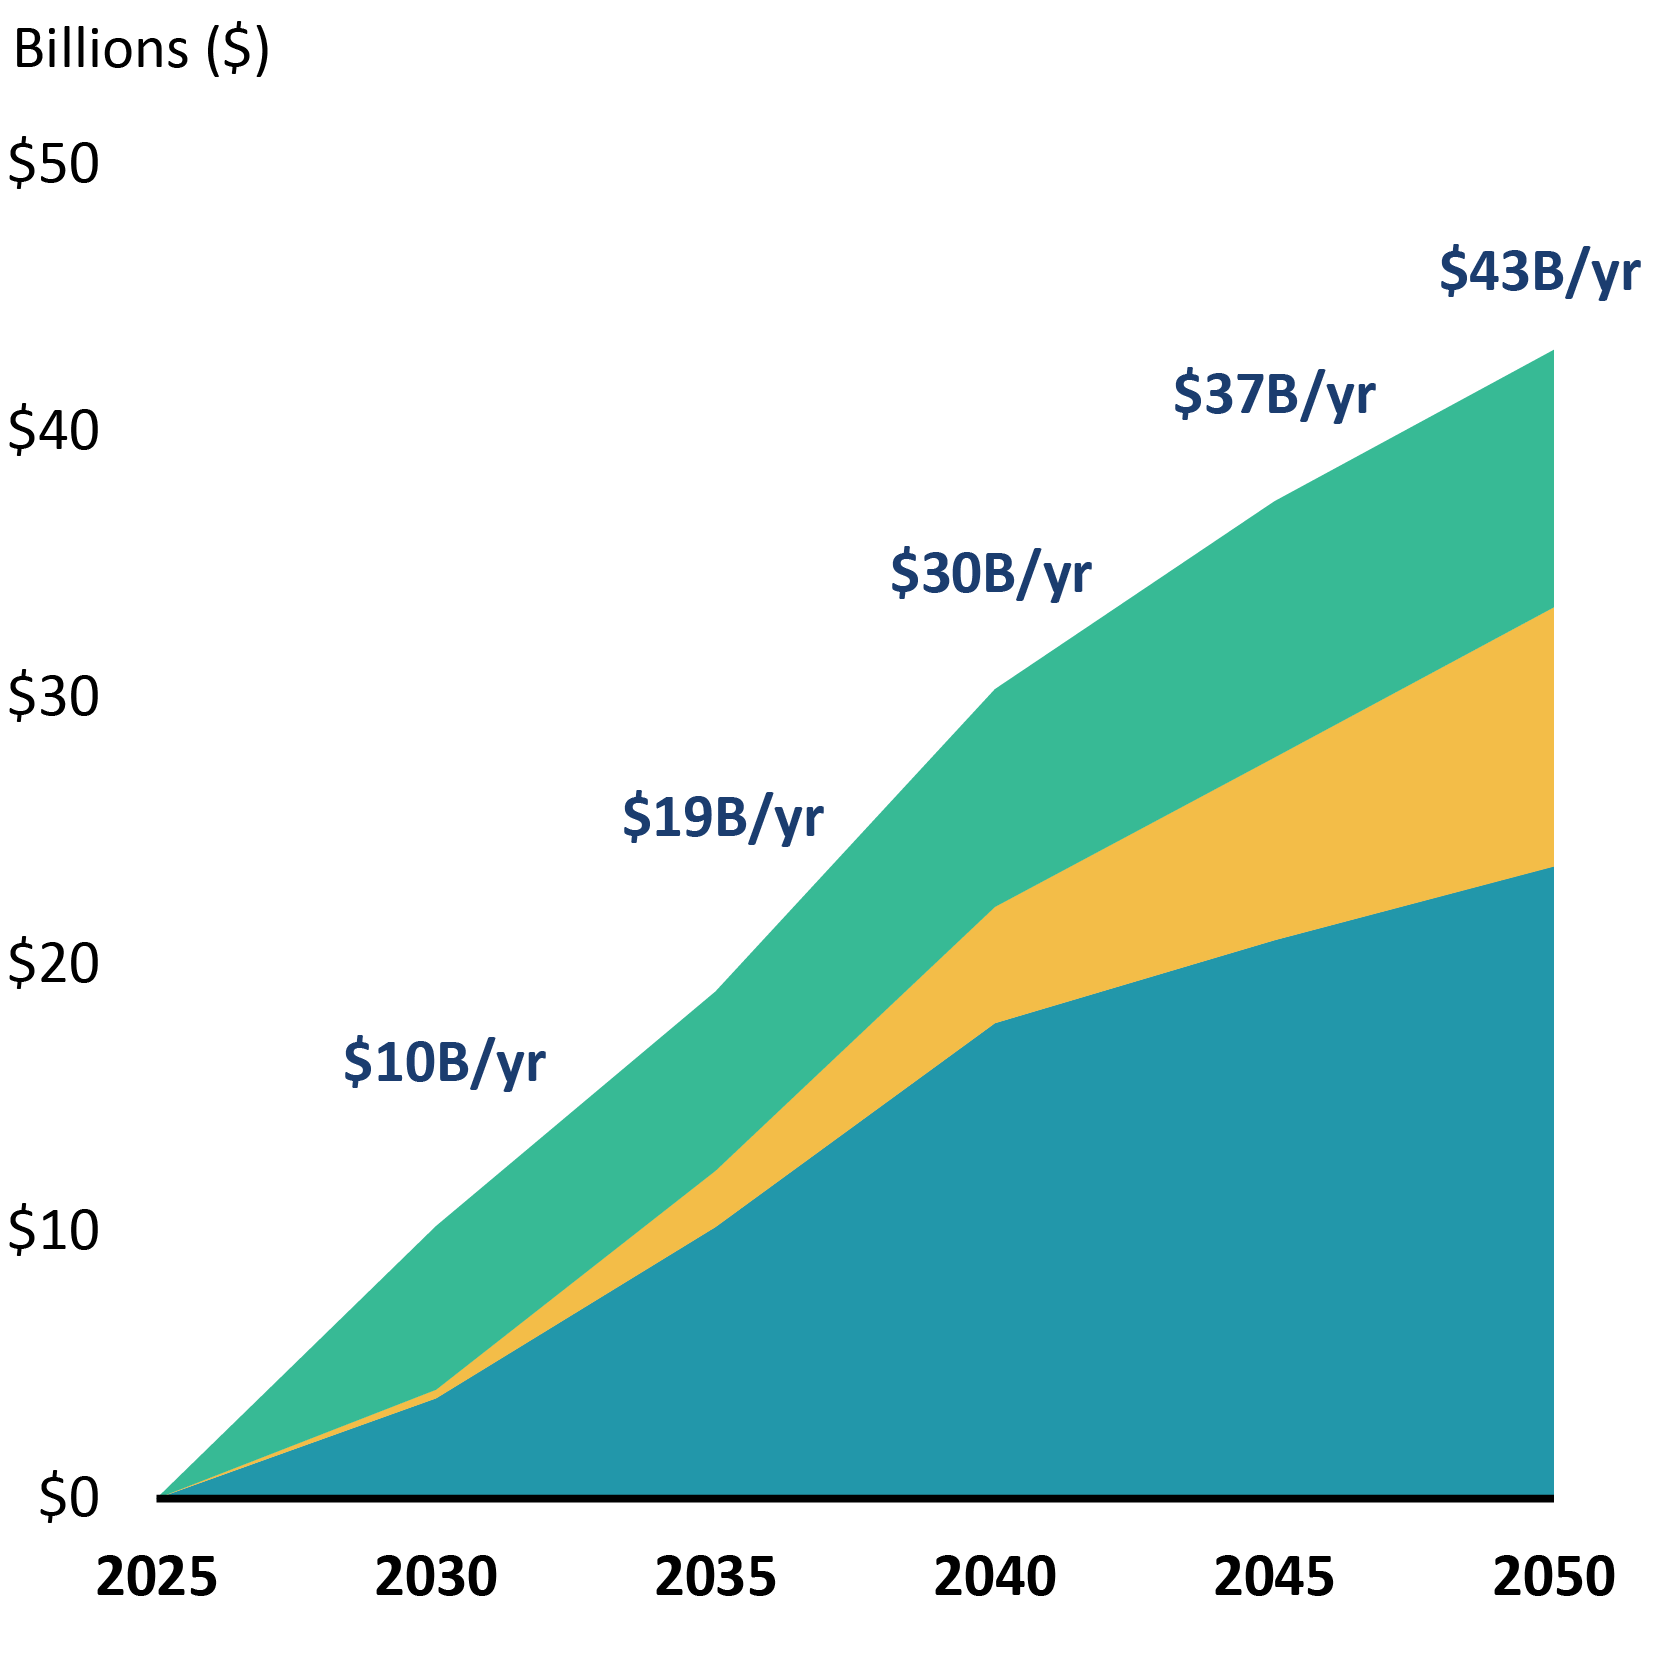
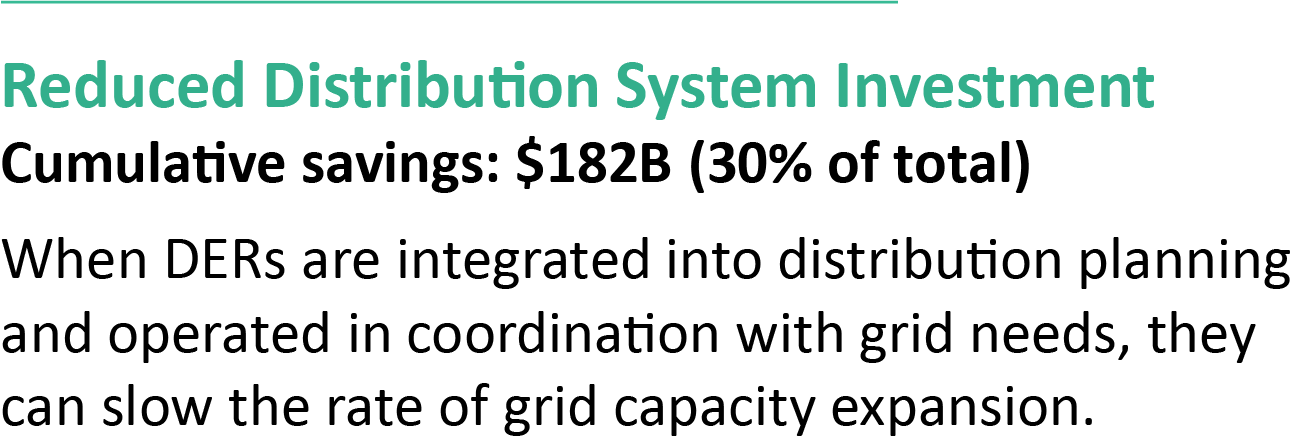
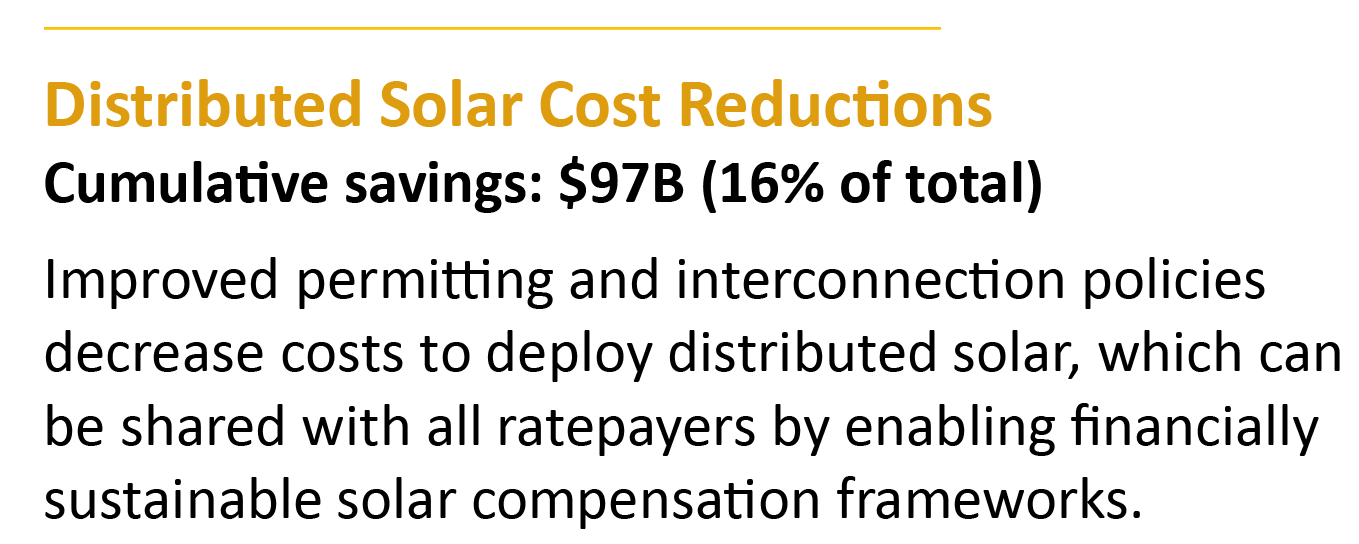
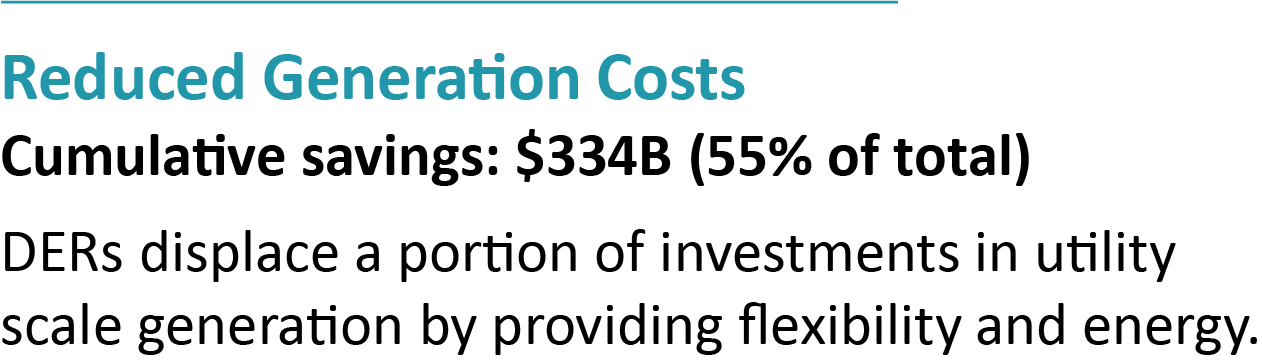
Roughly half of the cumulative value comes from avoided generation investment and operating costs, and another one-third comes from deferring growth-driven distribution upgrades. Policies to streamline permitting and interconnection add further value by reducing the cost of distributed solar.
Relative to a status quo outlook, expanded DER deployment could avoid over $600 billion in cumulative power system costs through 2050 (inflation-adjusted, undiscounted).



Click to expand
Click to expand
Click to expand

Figure 2: Annual US Electric System Avoided Resource Costs
After accounting for the costs of enabling DER deployment, the expanded portfolio could offset roughly half of projected household electricity bill increases beyond inflation by 2035 and save households an estimated $122 per year by 2050 (in inflation-adjusted terms).
DER cost savings would meaningfully reduce projected household electricity bill increases.
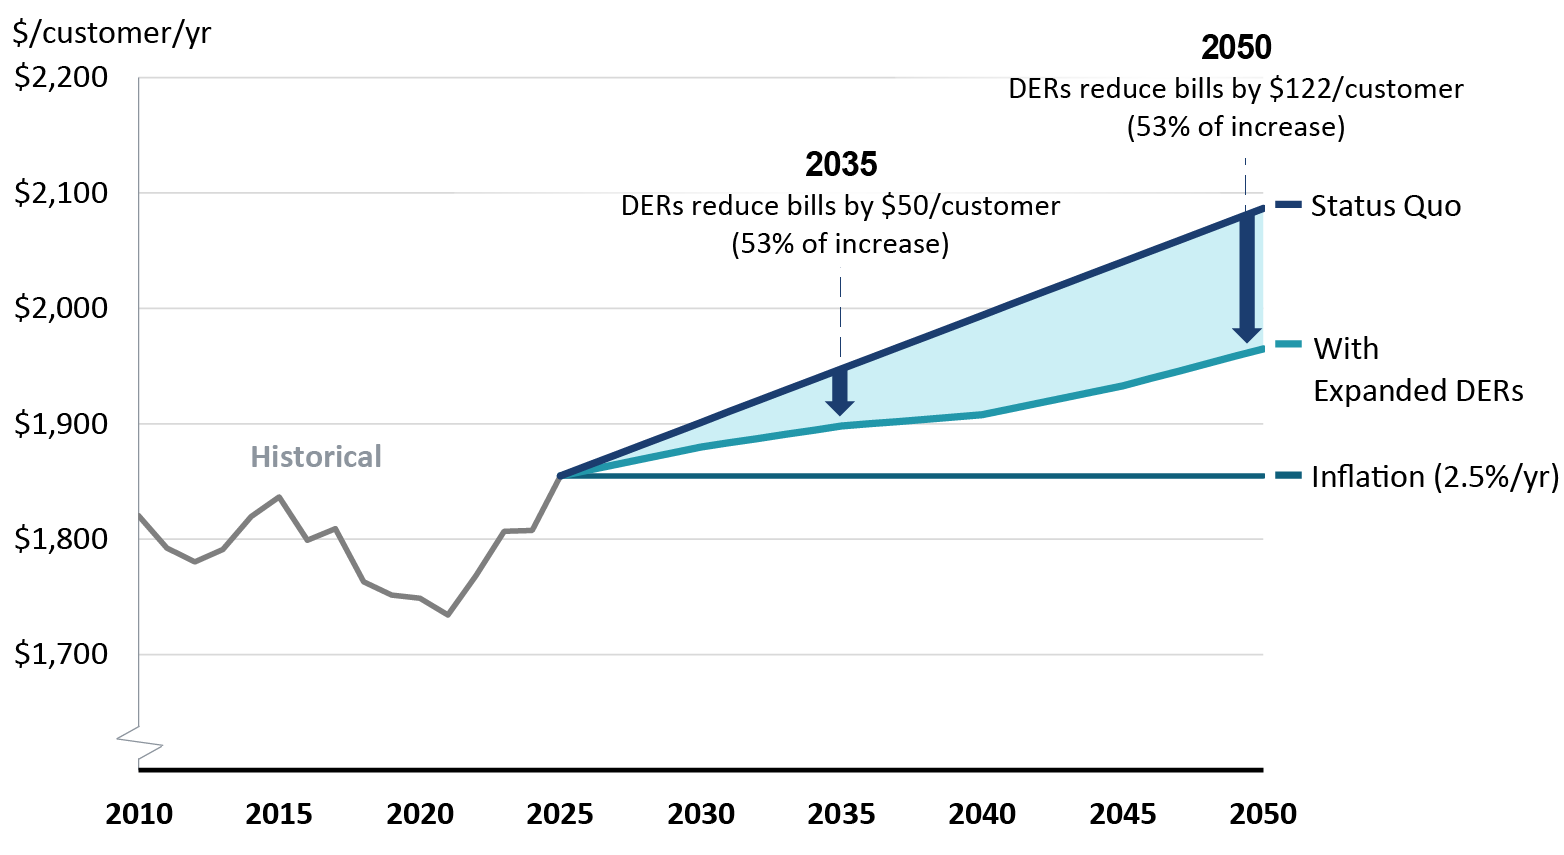
Notes: The status quo rate growth trajectory is based on an assumed 0.5% average annual real growth in residential electricity rates across the full study horizon, consistent with projections in the US Energy Information Administration’s Annual Energy Outlook. For comparison purposes, this assumes no change in annual residential electricity consumption. Changes in electricity consumption would alter the average bill trajectory, but that is a distinctly separate consideration from the affordability impact we analyze here.
Figure 3: US Average Annual Residential Electricity Bills (Inflation-Adjusted 2026 Dollars)
How the Planning Flexibility of DERs Reduces Stranded Asset Risk (Illustrative)
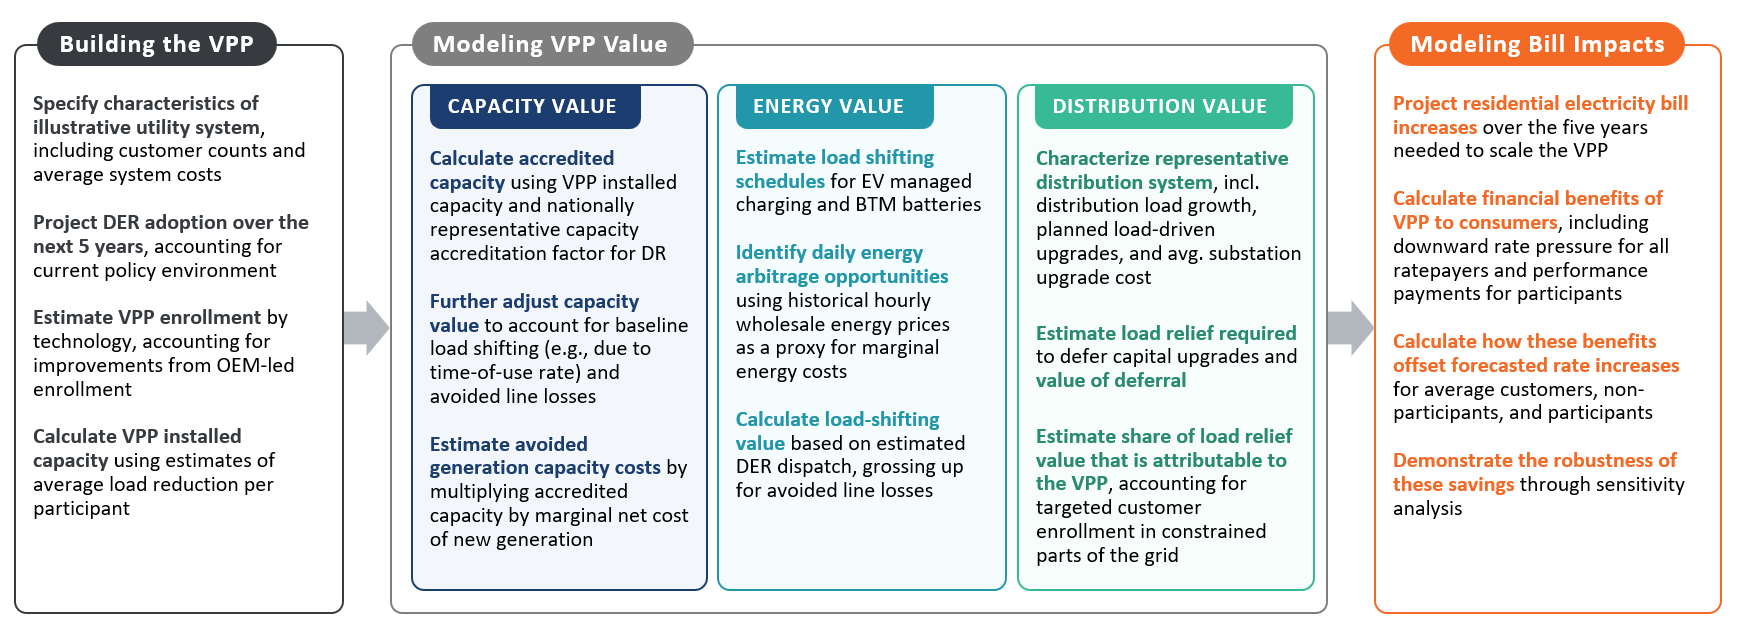
How the Planning Flexibility of DERs Reduces Stranded Asset Risk (Illustrative)
In a scenario targeting a carbon-free power sector by 2050, the flexibility of DERs could avoid the need for roughly 175 GW of cumulative large-scale generation capacity, lowering the incremental costs of the decarbonization transition by 20% in 2050.
DERs could reduce emissions and improve the affordability of decarbonizing the power sector.
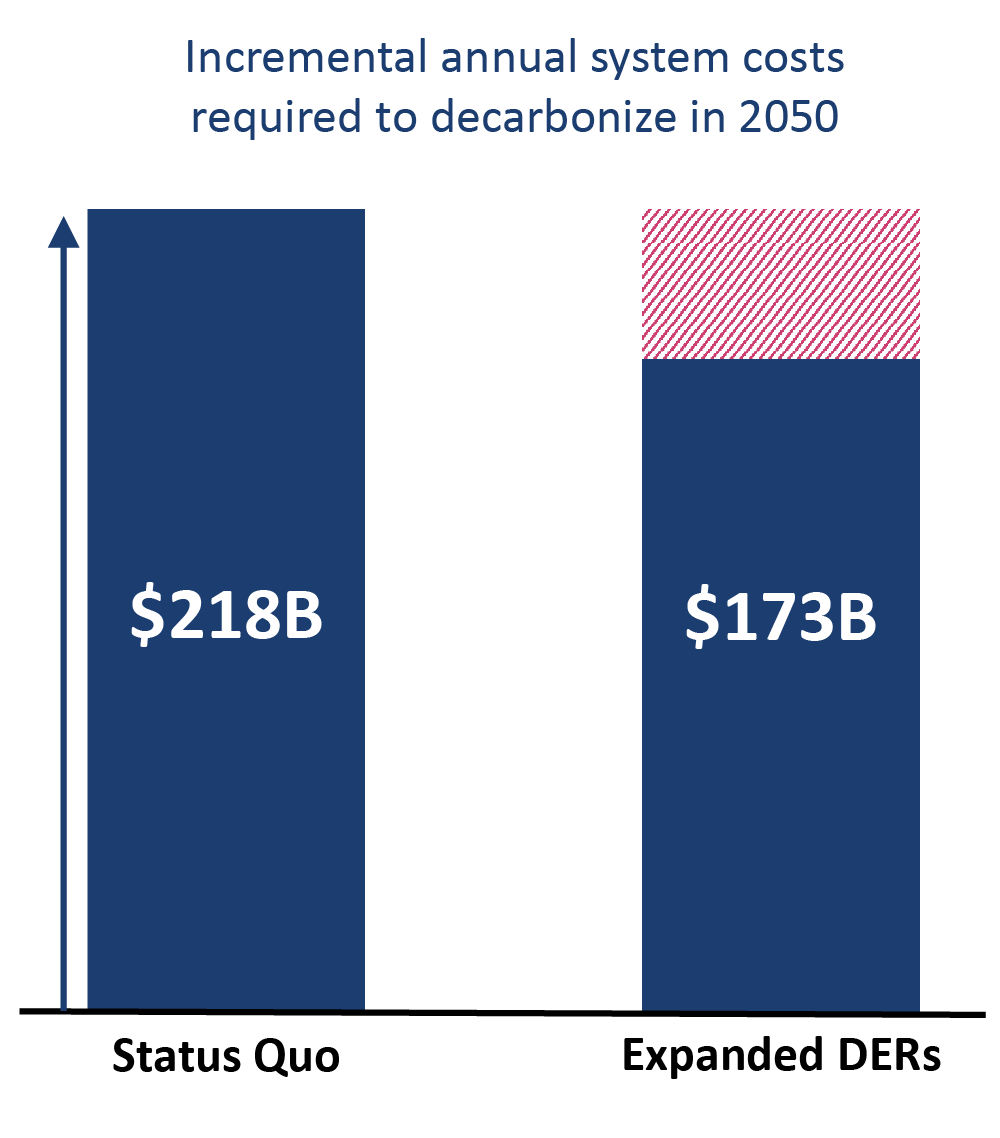
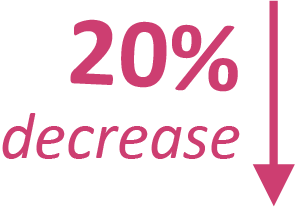
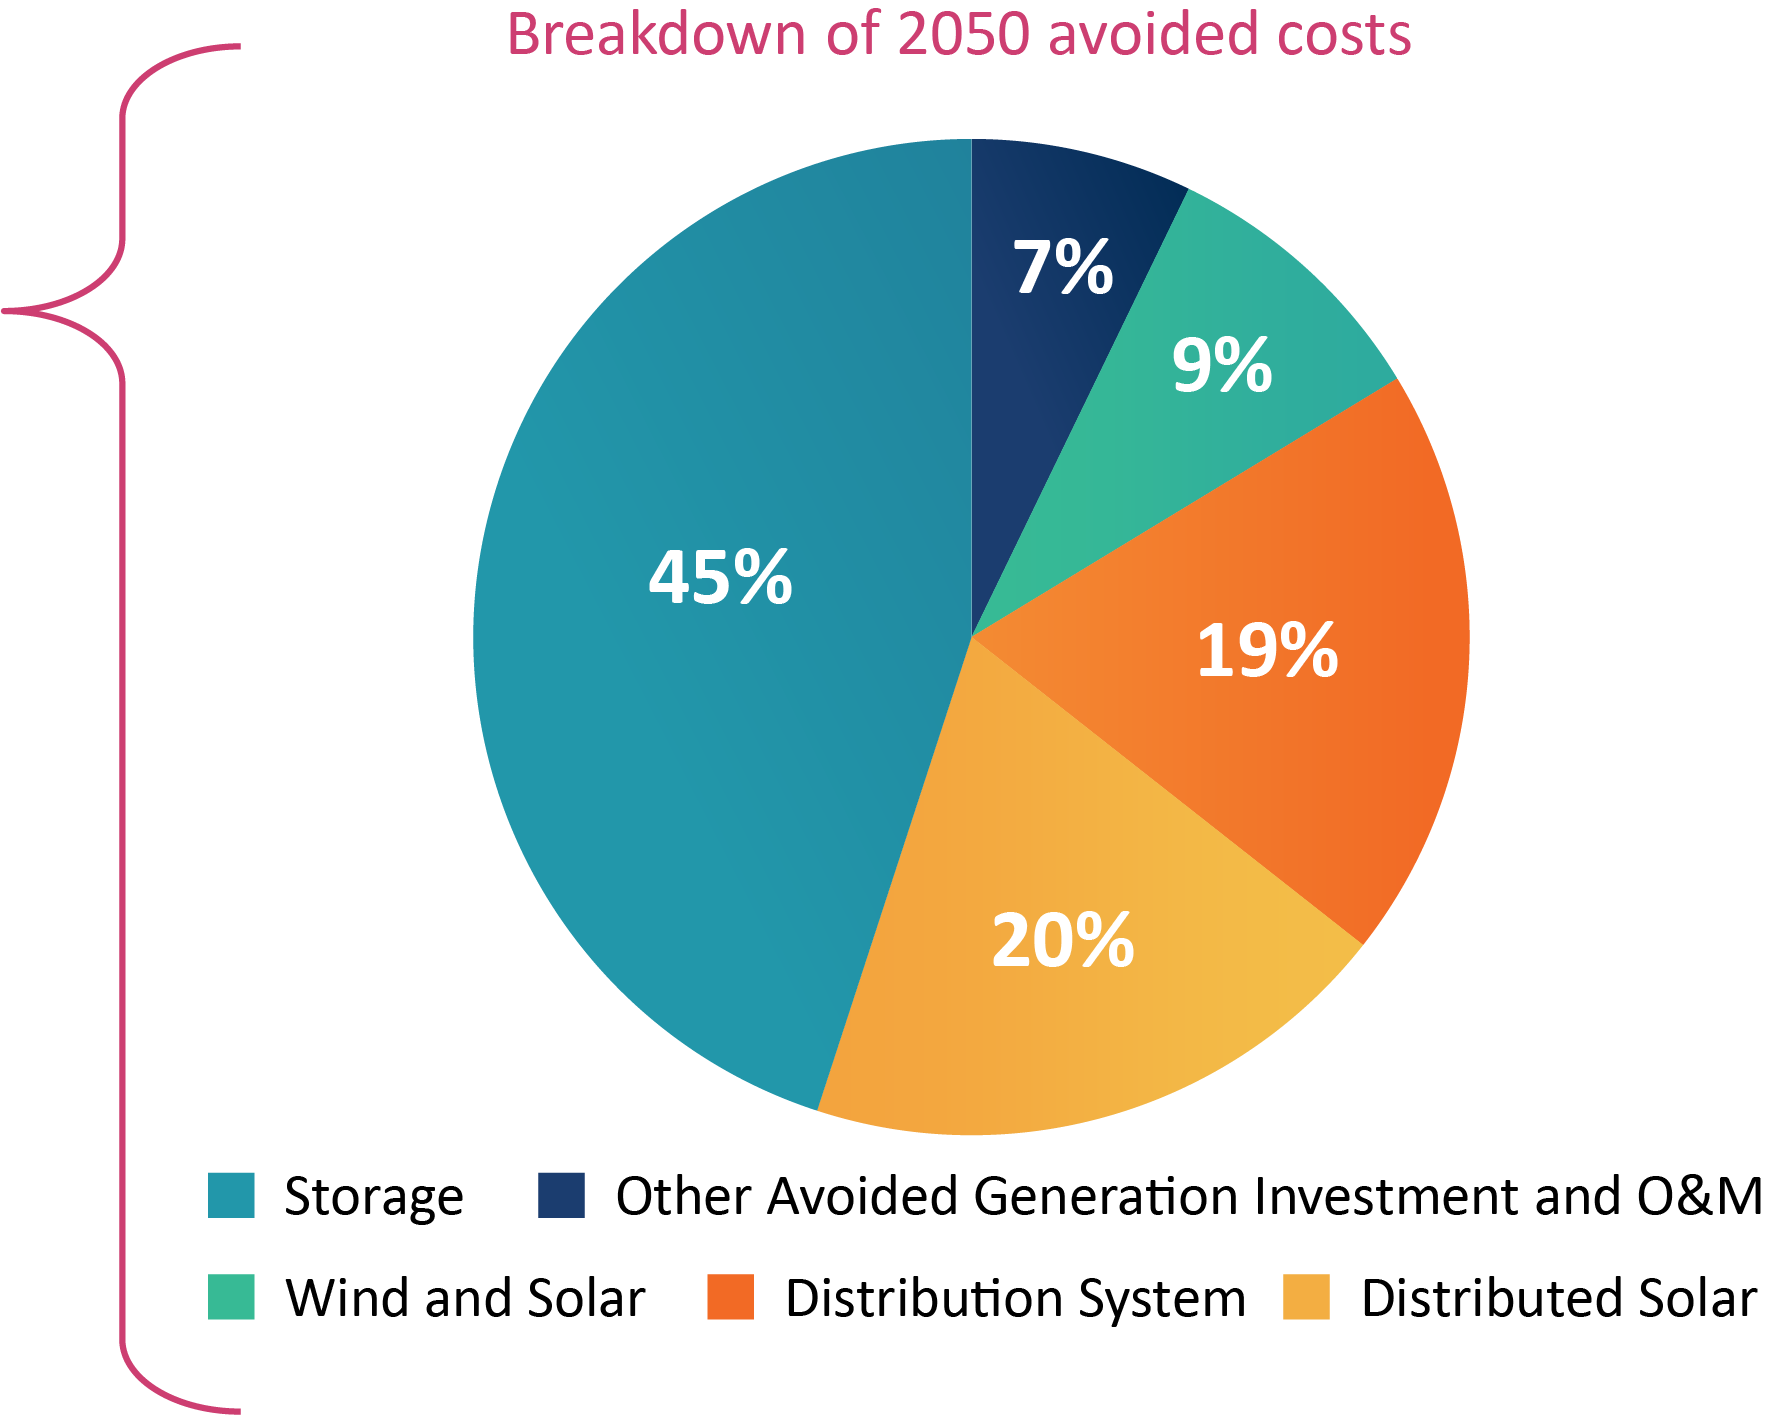
Figure 4: Reduction in US Power Sector Decarbonization Costs Due to DERs (2050)
Three practical policy initiatives could unlock over 40% of the identified DER benefits.
Integrating DERs into distribution planning and operations, streamlining permitting, and reforming interconnection to enable flexible exports together account for 43% of the cumulative national benefits estimated in this study. These reforms are not a complete policy agenda, but they are high-impact near-term steps toward allowing DERs to compete as a core grid resource.
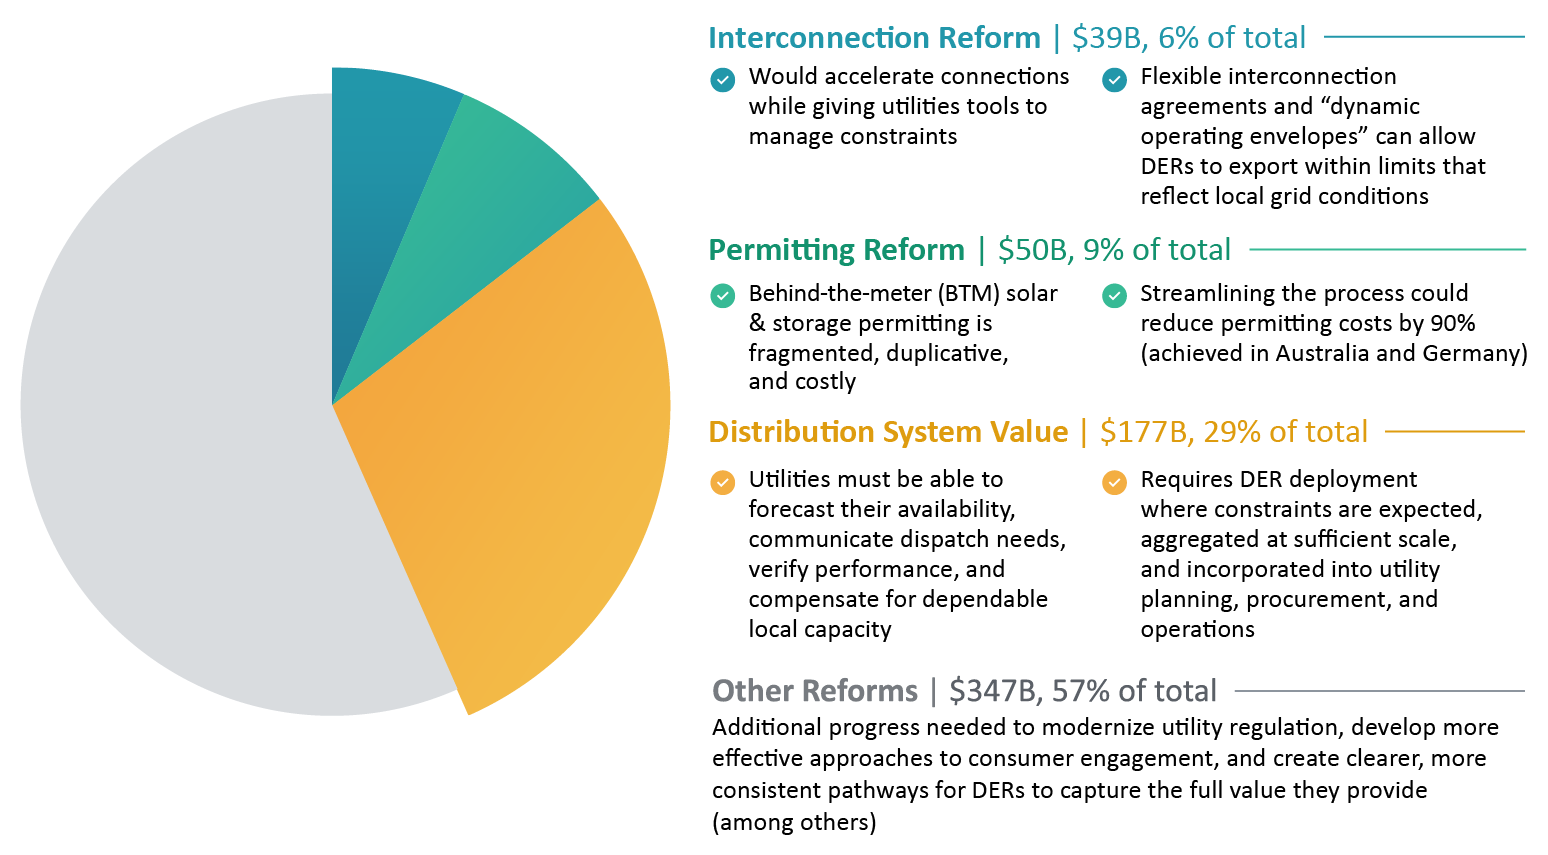
Figure 5: Contribution of Three Policy Initiatives to National DER Benefits
Read Anytime, Anywhere
Access the PDF version of our report for easy offline viewing and sharing. To learn more, please contact our report authors.
Read the Technical Appendix
Read the Full Report
authors
about brattle
The Brattle Group is a premier global consulting firm specializing in economics and finance. With more than 550 professionals across North America, Europe, and Asia-Pacific, and a distinguished network of leading academics and industry experts, we bring analytical rigor, credibility, and clarity to complex challenges. For decades, clients have trusted Brattle for independent analysis in litigation, energy and financial markets, and regulatory and strategic advisory settings.
For additional information about our experts and services, please visit brattle.com.
Defined by excellence and committed to delivering clarity in the face of complexity.