
The Road to 100% Renewable Electricity by 2030 in Rhode Island



The Road to 100% Renewable Electricity
by 2030 in Rhode Island
Prepared by



In January 2020, Governor Gina M. Raimondo signed Executive Order 20-01 that set a first-in-the-nation goal to meet 100% of Rhode Island’s electricity demand with renewable energy by 2030. Decarbonizing the electric sector by providing energy from renewable sources is foundational to decarbonizing the Rhode Island economy, and achieving long-term economy-wide greenhouse gas reduction targets consistent with the Resilient Rhode Island Act.
To help guide the analysis and the policy recommendations for achieving the goal, the project team developed a set of guiding principles, with input and feedback from stakeholders. The Guiding Principles represent three broad themes: A) Decarbonization Principles; B) Economic Principles, and C) Policy Implementation Principles.
Decarbonization Principles
- Exemplify Climate Leadership
-
Create Incremental Power Sector Decarbonization
-
Facilitate Broader Decarbonization
Economic Principles
-
Pursue Cost Effective Solutions
-
Improve Energy and Environmental Equity
-
Create Economic Development Opportunities
Policy Implementation Principles
-
Ensure Solutions are Robust and Sustainable Beyond 2030
-
Build on Rhode Island’s Existing Renewable Energy Mechanisms
-
Be Consistent with Other Rhode Island Priorities and Policies
For the purposes of the analysis, we assume that Rhode Island will track its progress to achieving 100% renewable electricity in 2030 by increasing the Renewable Energy Standard (RES) to 100% in 2030.

Table ES 1: CANDIDATE RENEWABLE ELECTRICITY RESOURCES
Based on our analysis of recently added renewable energy resources and potential for new development, the candidate renewable energy resources are offshore wind, land-based wind, wholesale solar, and retail solar. The availability of each of these resources is summarized in TABLE ES-1. We considered other technologies but determined that their limited availability makes them unlikely to play a major role in achieving 100% renewable electricity.
TABLE ES-2: RECOMMENDATIONS SUMMARY
Technology
Offshore Wind
Land-Based
Wind
Wholesale
Solar
Retail
Solar
Outer continental shelf off Rhode Island coast
Location of
Available Resources
Northern New
England and Upstate New York
On high-voltage
transmission system in RI
and neighboring states
On lower-voltage
distribution system within Rhode Island
900 – 1,100 MW
Capacity of each technology
(Needed to fill entire 2030 Renewable Energy Gap)
1,300 – 1,700 MW
2,700 – 3,600 MW
3,200 – 4,300 MW
Sufficient capacity available in current wind lease areas will require significant offshore and onshore transmission upgrades; more cost-effective upgrades will require regional coordination.
Resource Availability and System Upgrade Required
Limited potential to fill the gap with New England resources without system upgrades of about $1 billion requiring regional coordination; some capacity may be available in New York, which is building out transmission infrastructure.
2,500 – 6,500 MW of technical potential for ground-mounted solar in Rhode Island, though transmission access may require increasing system upgrade costs; significant additional capacity is in development across New England; land-use concerns remain a significant challenge.
Economic potential of rooftop solar is limited (110 – 260 MW); smaller-scale, ground-mounted facilities connecting to a distribution system can fill a portion of the gap, though may face increasing system upgrade costs.
TABLE ES-2: RECOMMENDATIONS SUMMARY
Topic
Renewable Energy Standard
Balance Of Wholesale And Retail Renewable Electricity
Grounded in the three main components of this project – analysis, guiding principles, and public engagement – the Office of Energy Resources and consultants at The Brattle Group developed a set of recommendations and action steps for 2021 and beyond to advance Rhode Island toward a 100% renewable electricity future. We categorize our recommendations into three segments: Policy, Planning & Enabling, and Equity and summarize the recommendations in the table above.
Energy Efficiency And Demand Response
Amend the state’s RES to require 100% renewable electricity by 2030.
Develop market-driven approaches that allow for cross-technology competition where appropriate.
Support continuation of the Renewable Energy Growth (REG) program and net metering (NM), contingent on identification and integration of measures to improve sustainability, affordability, and equity.
Commence a forum for stakeholder dialogue and consensus-building on the long-term costs and benefits of the state’s net metering construct.
Extend the Renewable Energy Fund (REF) beyond its current 2022 sunset.
Support the burgeoning offshore wind industry that will be critical to the Rhode Island clean energy economy and a decarbonized future for the region.
Extend Least-Cost Procurement of energy efficiency and demand response beyond 2023 to at least 2030.
Policy Recommendations
Recommendation
TABLE ES-2: RECOMMENDATIONS SUMMARY
Topic
Recommendation
PLANNING AND ENABLING Recommendations
Integrated Grid Planning
Power Sector Transformation
Energy Storage And Demand Mangement
Regional Collaboration On Markets And Transmission
Consider key drivers of system needs, such as distributed renewable energy and electrification, over longer time horizons to better understand and plan for changing future system needs.
Analyze transmission and distribution system needs for several 100% renewable energy scenarios to identify potential grid challenges and development opportunities.
Initiate a collaborative effort with National Grid, state agencies, municipalities, and other key stakeholders to explore the potential for a more integrated approach to grid planning beginning in 2021.
Explore how we might collectively enhance grid visibility and improve forecasting.
Improve forecasting and implement a stakeholder engagement plan during forecast development.
Consider strategies to compensate the value of distributed energy resources based, in part, on their location, and how those incentives align with more proactive distribution system planning.
Advance electrification that is beneficial to system efficiency and greenhouse gas emission reductions.
Consider opportunities for developing performance incentive mechanisms.
Develop a Rhode Island-centric strategic plan for the role of energy storage and demand management as renewable deployment increases through 2030 and beyond.
Explore the role of programs and incentives in achieving optimal, cost-effective energy storage penetration at beneficial locations on the grid, as well as how demand management capabilities can be acquired and sited.
Continue coordination with other New England states on wholesale market designs and transmission planning processes that facilitate energy decarbonization and renewable resource integration across the region.
Coordinate with other New England states on transmission planning processes to better facilitate energy system transformation and proactively plan for the integration of large-scale resources and distributed energy resources across the region.
Identify and implement wholesale market mechanisms that fully account for the value of existing and future state-level investments in renewable resources and meet states’ decarbonization mandates and maintain resource adequacy at the lowest possible cost.
TABLE ES-2: RECOMMENDATIONS SUMMARY
Topic
Community Partnerships
Improve Community- Determined Outcomes
Equity Metrics
Partner with and listen to frontline communities about their needs and goals in the clean energy transition.
Target community-based training efforts to support in-demand clean energy jobs.
Provide education about the opportunities and challenges available in creating clean energy programs and policies, and information about energy programs, including comparative costs and benefits.
Improve outcomes identified and prioritized by communities through rate design, program adjustments, and policy.
Reduce barriers to participation through effective and culturally competent program design and delivery.
Reduce financial burdens and provide support for low- and moderate-income households and frontline communities beyond installing technology, including structures for aiding with upkeep and services.
Develop metrics to track progress toward community-identified equity outcomes.
Equity Recommendations
Recommendation
FIGURE ES-1: RENEWABLE ELECTRICITY GAP TO ACHIEVE 100% RENEWABLES
With the expected addition of 400 MW of offshore wind capacity from the Revolution Wind project in 2024, Rhode Island is already on pace to support about 3,060 GWh of renewable energy generation in 2030. This equates to about 40% of Rhode Island’s projected 2030 electricity demand.
As shown in FIGURE ES-1, Rhode Island will need to add about 4,600 GWh of additional renewable energy to close the remaining renewable electricity gap to reach 100% by 2030, reflecting a relatively flat outlook for electricity demand.
This represents a 150% increase in the amount of renewable energy procured to date. The estimated renewable energy gap may be 600-700 GWh larger or smaller, depending on the rate at which the transportation and heating sectors electrify to increase demand and reduce greenhouse gas emissions, and the future progress of energy efficiency efforts that decrease demand.
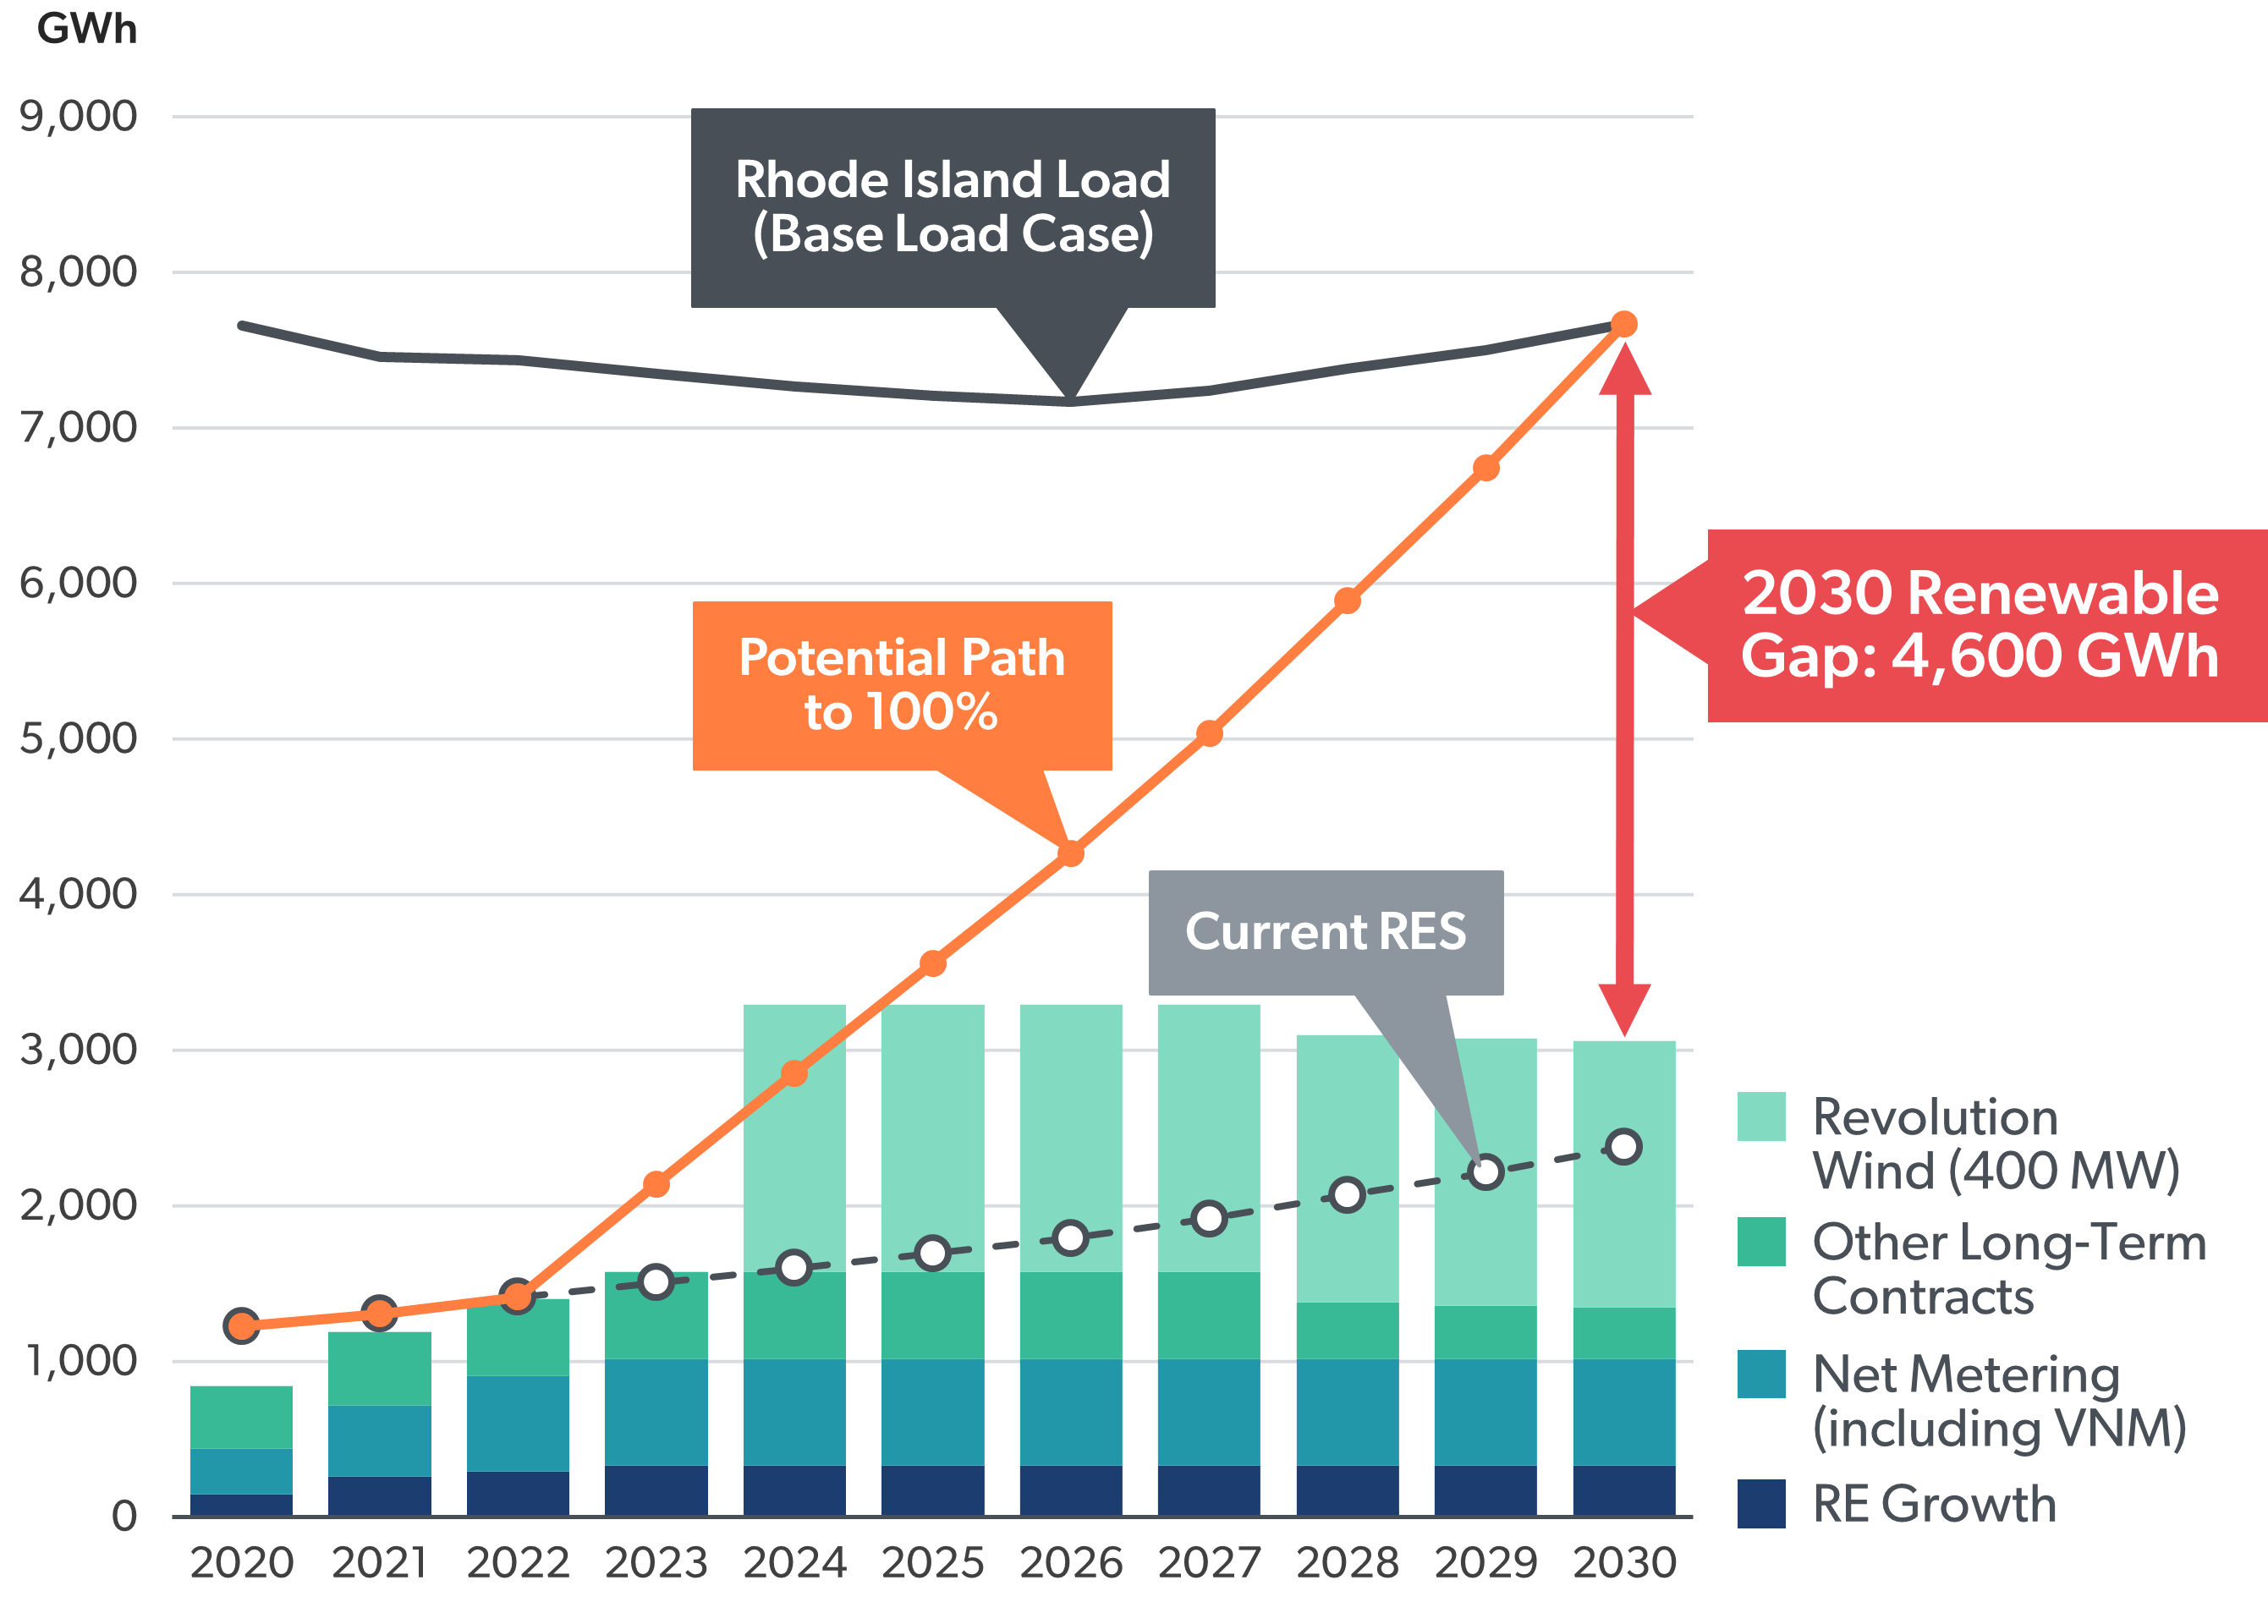
FIGURE ES-2: NPV OF ABOVE-MARKET COSTS (2020–2040) OF ACHIEVING 100% RENEWABLES; BOOKENDS (NET OF ENERGY AND CAPACITY REVENUES, NOT REC REVENUES)
FIGURE ES-2 compares the four Technology Bookends, showing the estimated above-market costs of achieving 100% renewable electricity entirely with each one of the four candidate technologies. The figure shows the net present value (NPV) of 2020 to 2040 above-market costs, with the labeled point reflecting Base Case cost assumptions, and the bar reflecting the uncertainty in renewable acquisition costs. The net costs of the three utility-scale Technology Bookends are quite similar, with Base Case above-market costs of $1,900 million to $2,100 million and largely overlapping cost ranges.
The Retail Solar Bookend results in materially higher above-market costs of $4,500 million, reflecting its significantly higher resource cost. As a reference point, the cost of market REC purchases is shown at the top of the figure, where $30/MWh RECs could fill the entire renewable energy gap at a cost $1,400 million.
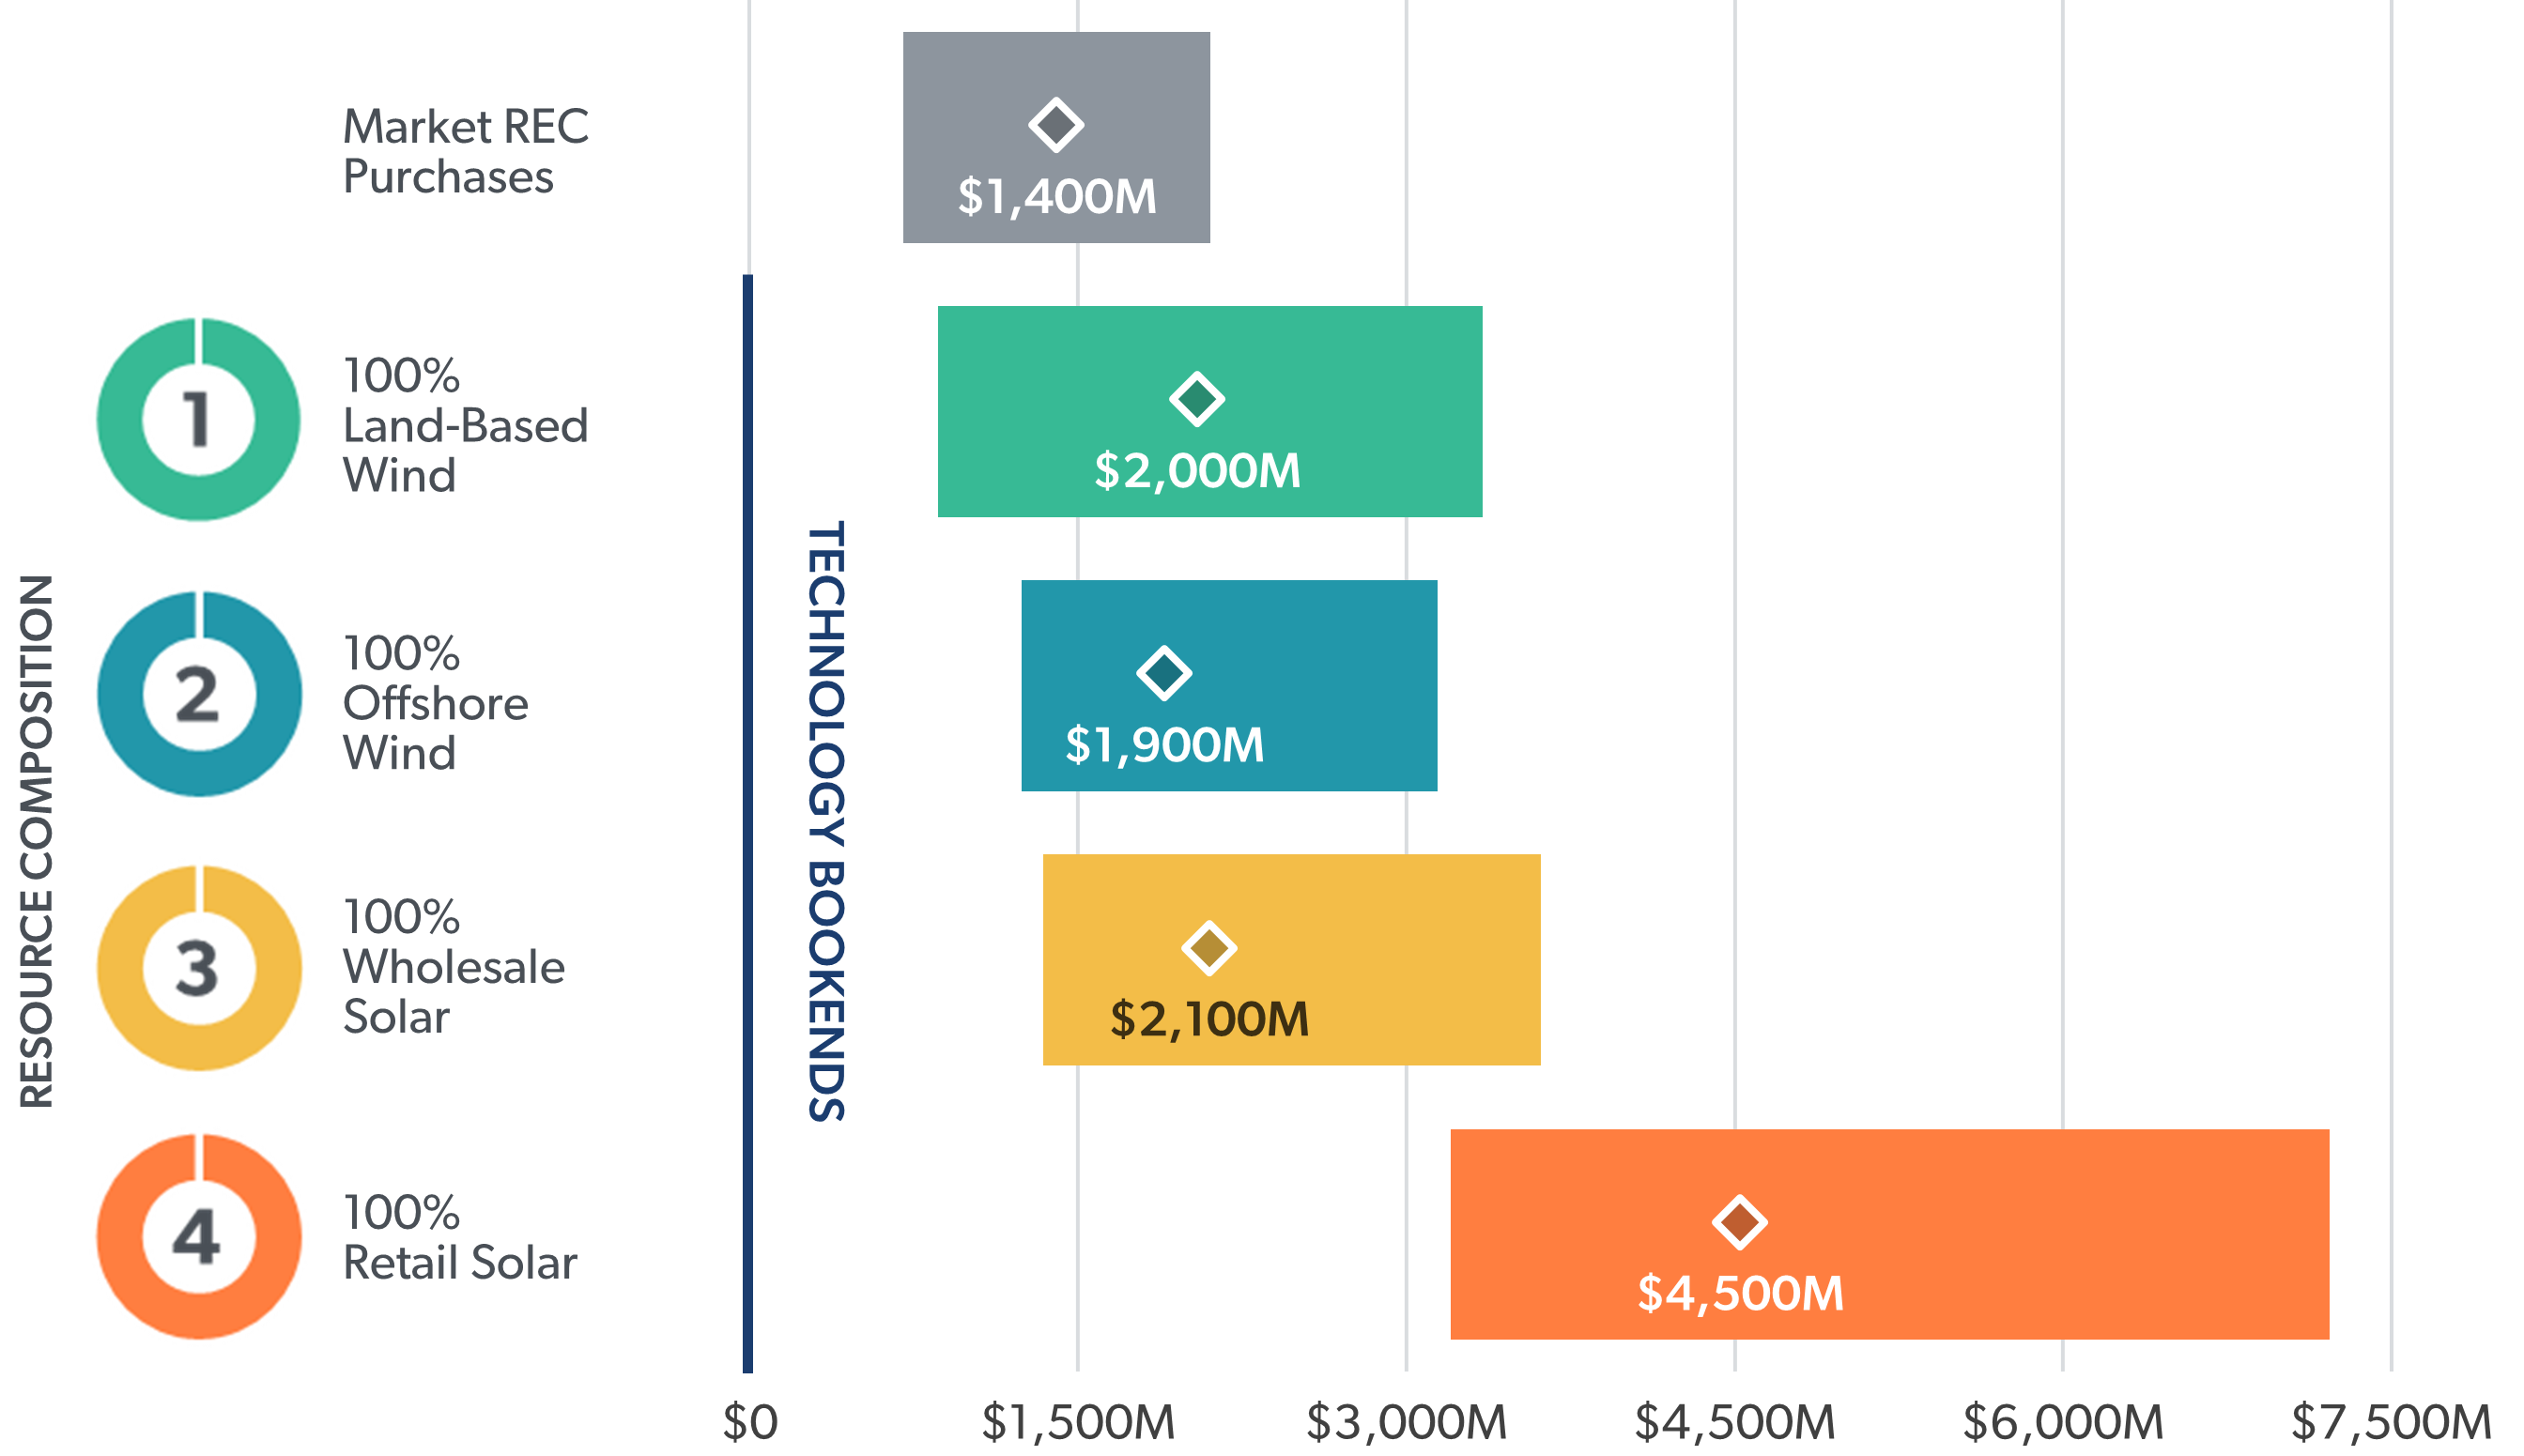
FIGURE ES-3: 2030 RATE IMPACTS OF 100% RENEWABLE ELECTRICITY
It will be valuable for Rhode Island to continue to seek out opportunities to foster competition among these resources, across types as well as within them, to identify the particular technologies and projects that are most attractive for the state to reach 100% renewable electricity. Retail solar is significantly higher cost, but offers greater local economic benefits.
The retail rate impacts of the three utility-scale Technology Bookends are similar, at roughly 2 cents/kWh (range 1 to 5 cents/kWh) in 2030, while the retail solar impact is higher at 6 cents/kWh (range 4 to 11 cents/kWh), as shown in FIGURE ES-3. These rate impacts would increase a typical monthly residential bill in 2030 by about $11 to $14 with utility-scale renewables, or by $30 if the entire gap were to be filled with retail solar.
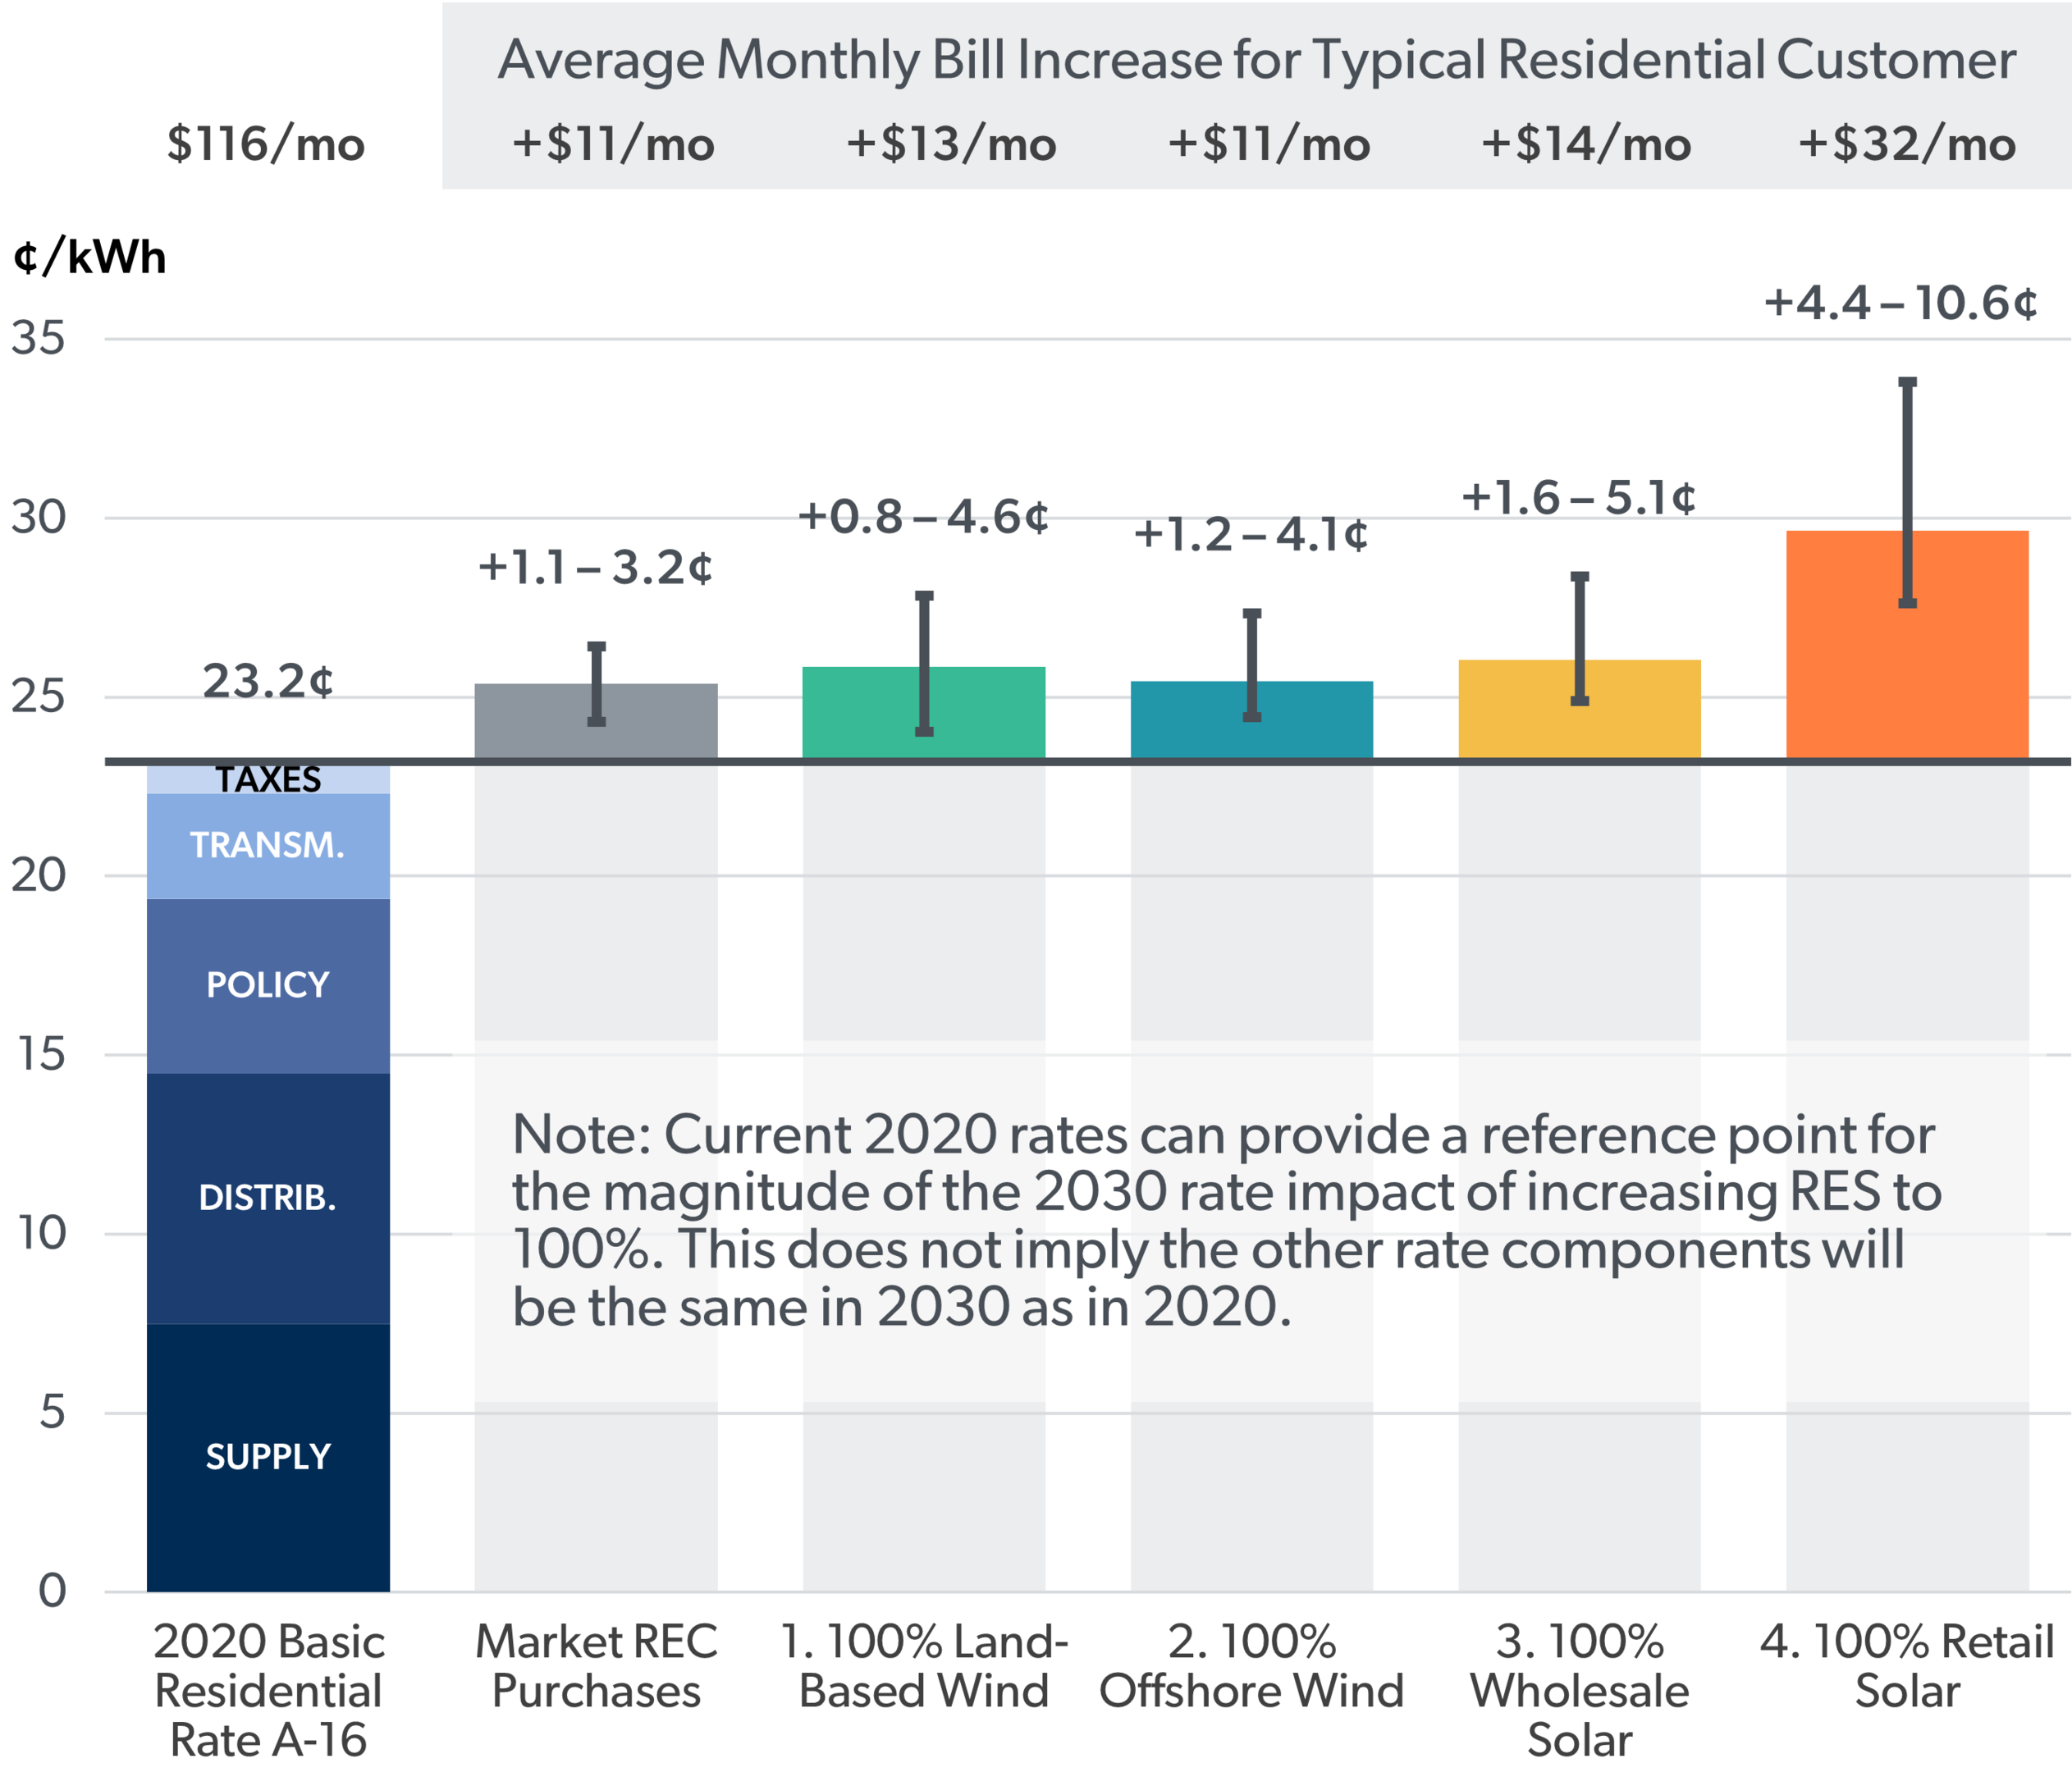
FIGURE ES-4: NPV OF RHODE ISLAND GDP IMPACT (2020–2040) WITH UNCERTAINTIES; BOOKENDS
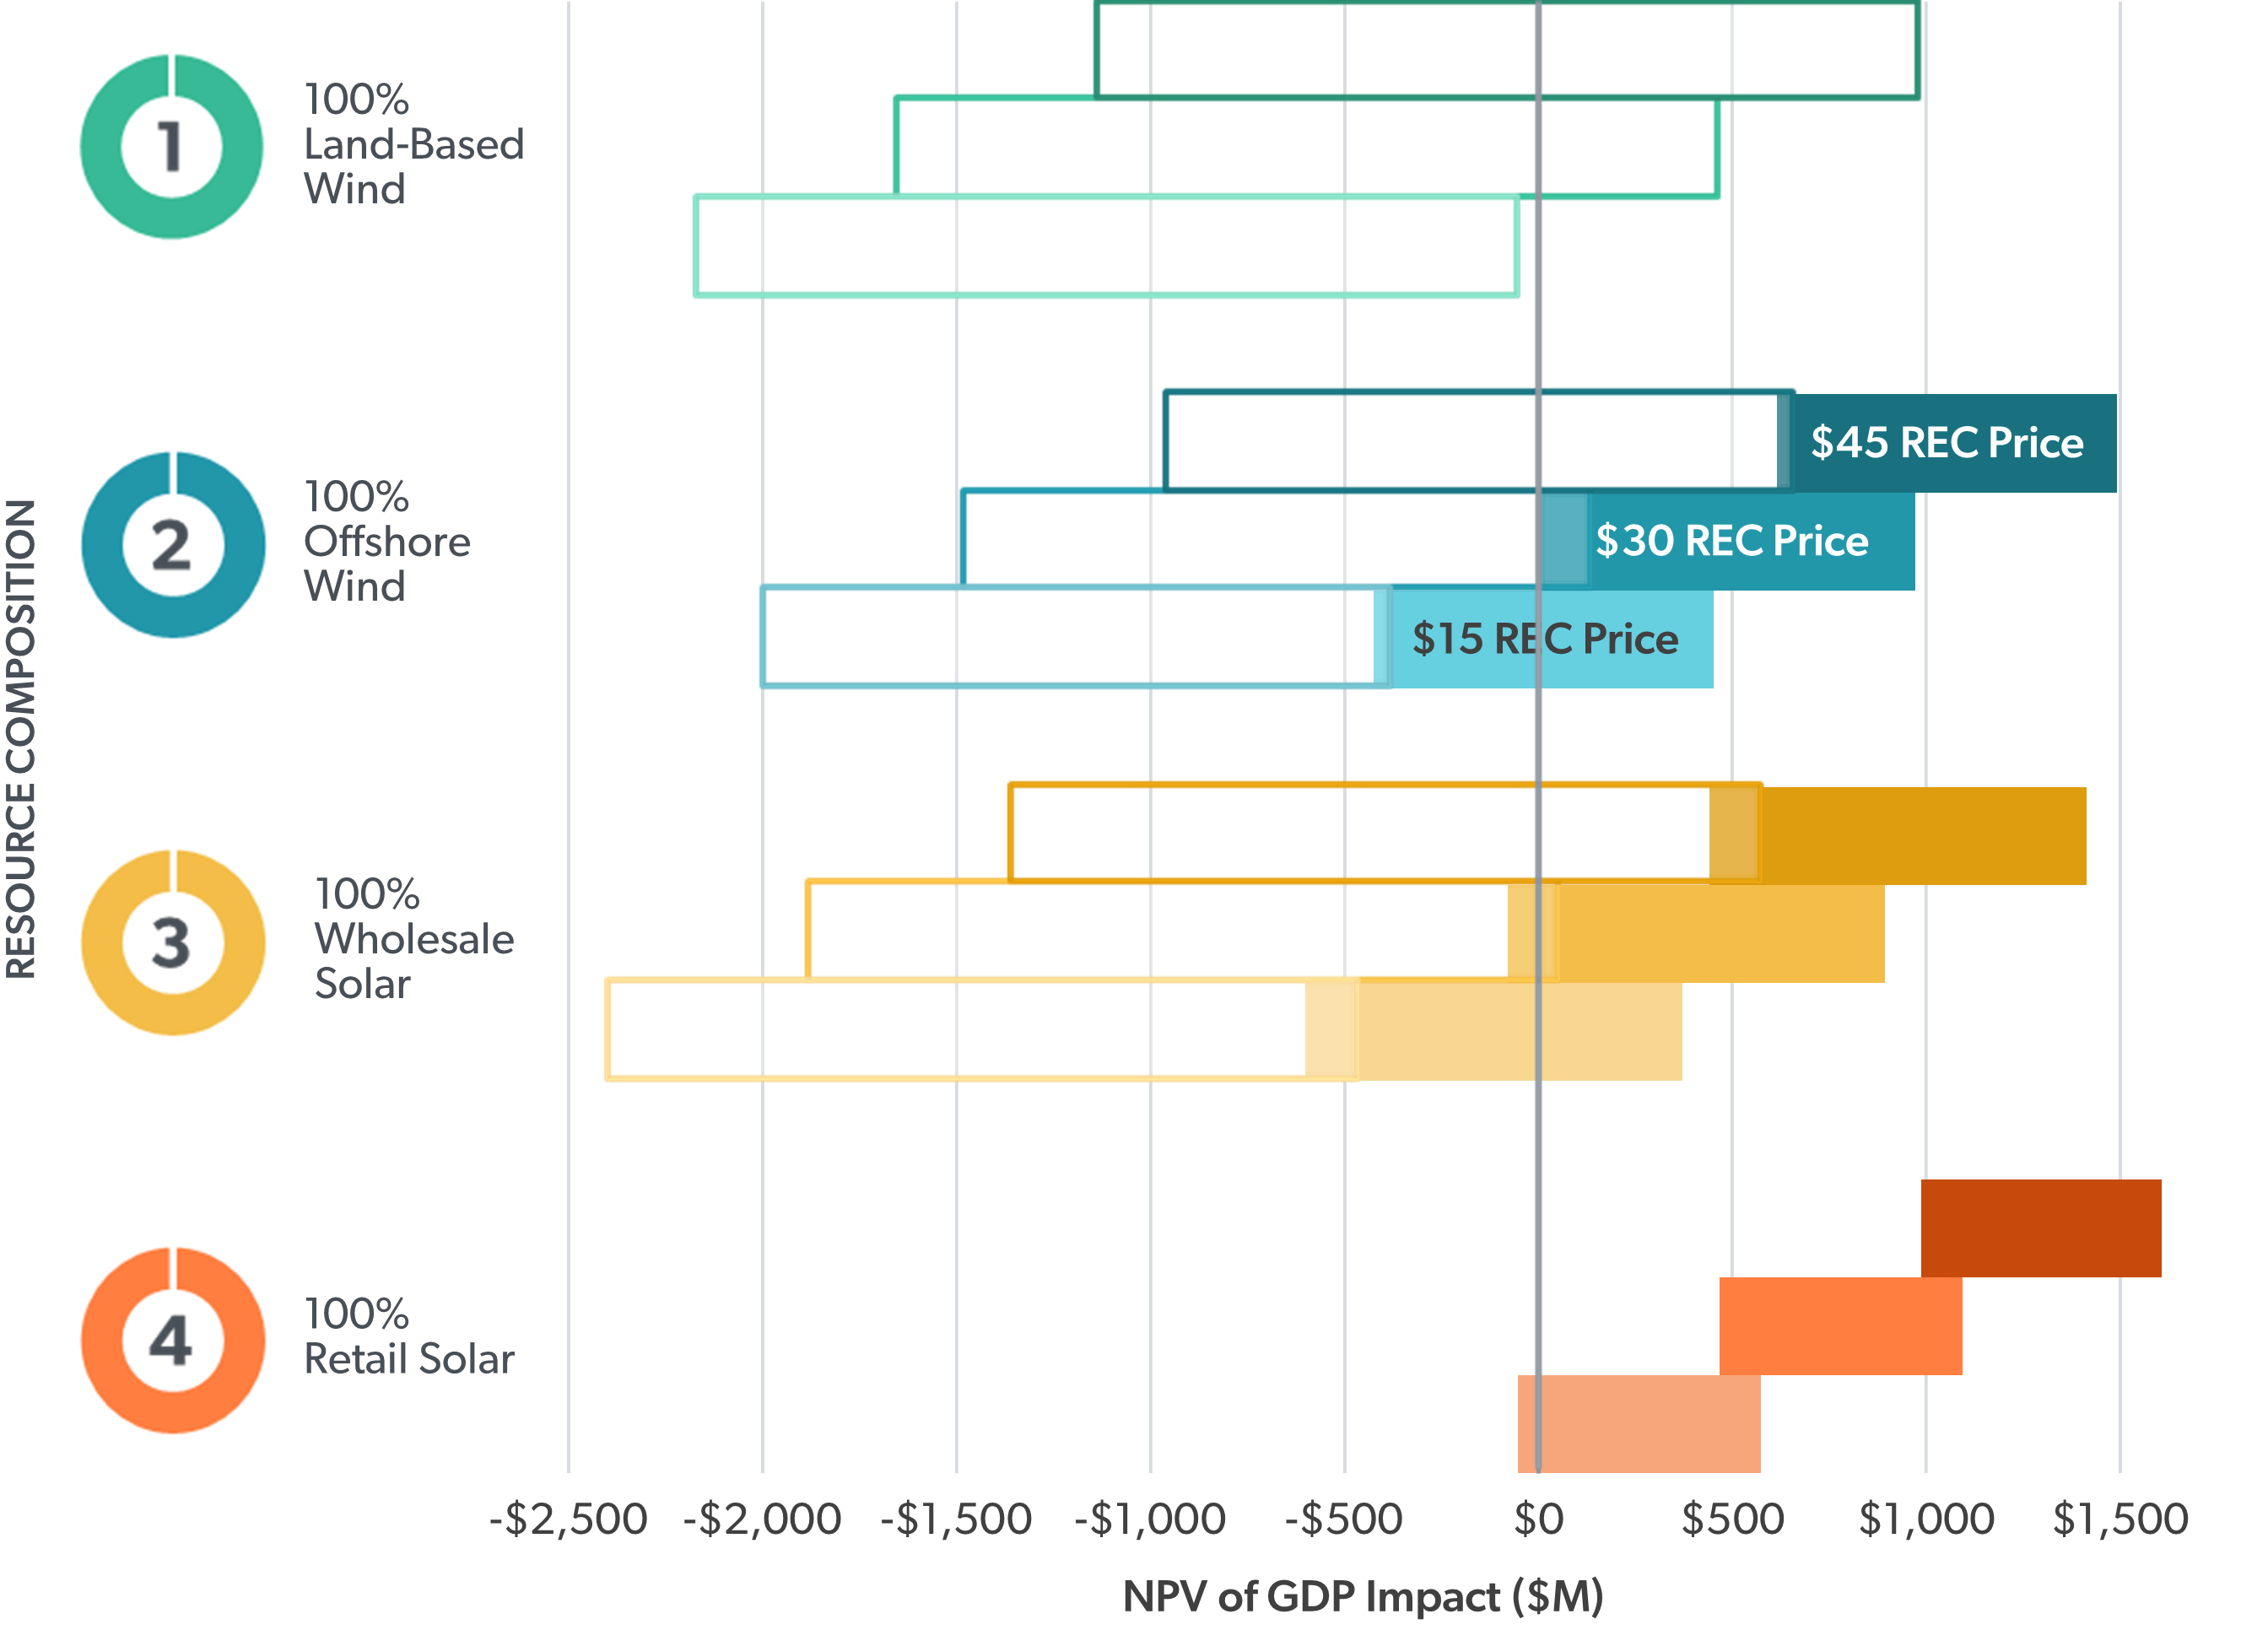
FIGURE ES-4 shows the NPV of GDP impacts for each of the Technology Bookends. Much information is included in this figure, including the range of uncertainty due to resource cost (the length of each bar), the REC price used as a comparison value (from one bar to the next) and comparing in-state technologies (solid bars) versus out-of-state technologies (outline bars).
Of course, any technology’s economic impact is better when compared to a higher REC price, and the impact is more positive at low resource cost than at high. The key insights here are that in-state resources have generally positive impacts relative to REC purchases, while out-of-state ones have lower and often negative impacts, and also a wider range of impacts.
authors
about brattle
The Brattle Group answers complex economic, finance, and regulatory questions for corporations, law firms, and governments around the world. We are distinguished by the clarity of our insights and the credibility of our experts, which include leading international academics and industry specialists. Brattle has 500 talented professionals across North America, Europe, and Asia-Pacific.
Rhode Island can maximize the benefits of achieving 100% renewable electricity by 2030 by leveraging market-based approaches to procuring additional renewable electricity, proactively planning Rhode Island and New England infrastructure, and identifying opportunities to develop in-state resources.
For more information, please reach out to the study authors.



Dean Murphy
Principal
Michael Hagerty
Principal
Jürgen Weiss
Principal