Managing Coal Plant Costs for an Orderly Transition to Decarbonization
Managing Coal Plant Retirements for an Orderly Transition to Decarbonization
Prepared by
Metin Celebi, Frank Graves, Robert Mudge, Long Lam
Coal plants are increasingly under economic pressure due to slow load growth, low natural gas prices, and declining wind and solar costs, among other factors. As a result, about 30% of US coal capacity has retired since 2010, with an additional 55 GW slated to retire by 2030.
In addition, mounting pressure to reduce greenhouse gasses is spurring decarbonization of the power sector, which will require the country’s remaining coal plants to either retire or eliminate their carbon emissions over the next 15–20 years.
Early retirement can be an appealing proposition for both utilities and customers, but recovery of major undepreciated investments remains a significant obstacle. Across the country, utilities’ unrecovered coal plant investments amount to over $100 billion.
Many utilities are transitioning to clean energy resources by relying on existing and new tools that help to recover undepreciated investments while reducing costs to ratepayers.

1
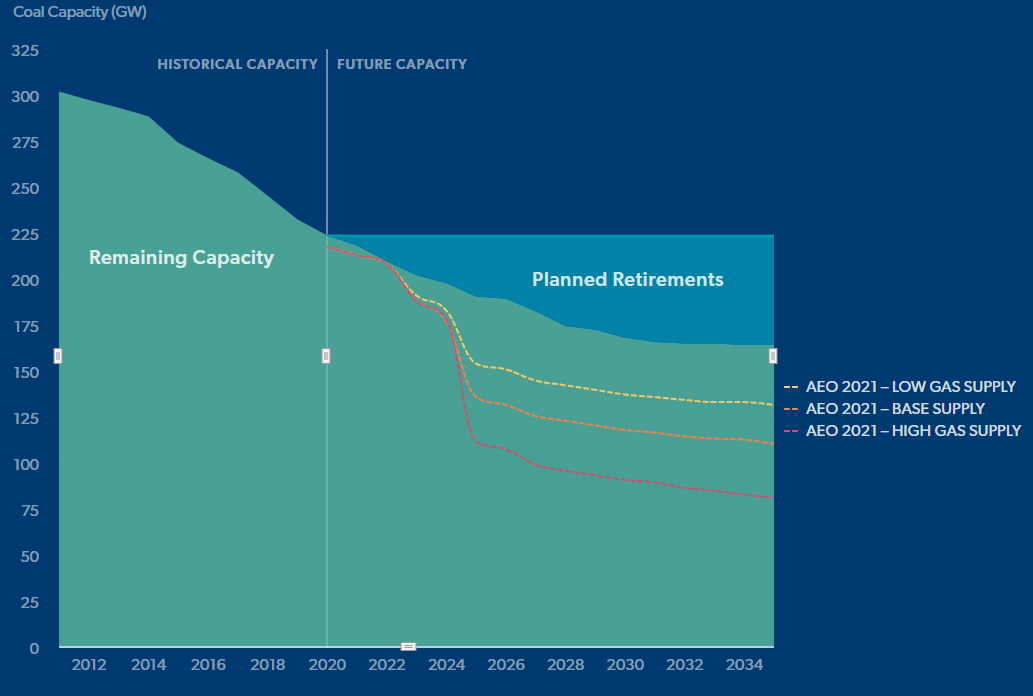
Retirements have reduced coal capacity, but remaining capacity will exceed what 2035 emissions targets require
The transition away from coal has already begun, but without further action, a substantial amount of coal capacity will remain in the US for decades. To reach Biden’s carbon-free electricity goal, 160 GW of additional coal capacity would have to either retire or eliminate its carbon emissions by 2035. Even absent further federal policy, coal plants are already experiencing worsening utilization and economic viability.
The share of regulated units among coal retirements have been increasing recently, and will account for most of the announced retirements by 2025 (see FIGURE 1).
Based on announcements to date, PJM will have more coal capacity than any other RTO starting in 2023, though PJM has retired coal capacity at the highest rate. Outside of the RTO regions, about 54 GW of coal will remain by 2030 (see FIGURE 2 below). At the end of the decade, PJM, MISO, and non-RTO regions together account for most of the remaining coal capacity.
Figure 1: US coal capacity projections. 168 MW will remain by the end of the decade.
Sources and Notes: Brattle’s analysis based on data from Velocity Suite, ABB Inc; US EIA Annual Energy Outlook 2021.
Figure 2: Coal capacity by RTO. PJM is poised to have the most coal capacity by 2023.
Sources and Notes: Brattle’s analysis based on data from Velocity Suite, ABB Inc.

2
Deteriorating economics of retaining coal plants
Coal plants are under economic stress in many parts of the United States. 170 GW of coal generation capacity in the US, or about two thirds of the fleet, had negative operating margins relative to electricity prices in regional markets in 2017. In PJM, only 5% of coal units recovered their avoidable costs in 2020, down from 26% in 2019 and 68% in 2018.
Decreasing electricity prices, flat load growth, low gas prices, and low renewable energy costs all place downward pressure on coal plants. A look at the main contributing factors:
Percent of Coal Fleet with Negative Operating Margins
0%
1-24%
24-49%
50-74%
75-100%
Figure 3: The majority of coal plants are under economic stress in the US.
Sources and Notes: Data from Metin Celebi et al., The Cost of Preventing Baseload Retirements, July 2018. Operating margins reflect revenues from capacity and energy net of operating costs in 2017.

PJM
|
TVA |
Cinergy
|
Arkansas |
Mid-C |
Palo
|
COB |
|---|---|---|---|---|---|---|
|
$34.32 |
$32.58 |
$33.07 |
$30.87 |
$32.86 |
$34.91 |
$31.87 |
|
$41.79 |
$35.00 |
$37.04 |
$26.04 |
$41.19 |
$40.39 |
$35.00 |
|
$30.87 |
$28.46 |
$30.10 |
$30.65 |
$32.91 |
$38.36 |
$28.46 |
|
$24.55 |
$24.17 |
$26.49 |
$20.90 |
$34.05 |
$33.20 |
$26.98 |
-28% |
-31% |
-20% |
-32% |
4% |
-5% |
-15% |
|
Full Year |
|---|
|
2017 |
|
2018 |
|
2019 |
|
2020 |
|
% Diff |
Figure 4: DECREASING ON-PEAK ELECTRICITY PRICES DEPRESS OPERATING MARGINS, INDICATING WORSENING UTILIZATION AND ECONOMIC VIABILTY FOR COAL PLANTS.
Sources and Notes: Data for obtained from Velocity Suite, ABB Inc. Data as of June 8, 2021. Cinergy spot prices are the average of CIN.DEI.AZ, CIN.GRNTWN.MVP, CIN.HEPM_1.AZ, CIN.HEPM_2.AZ, CIN.MAPLEA.MVP, CIN.PSI_3.AZ, CIN.SIGW_1.AZ, and CIN.WVPA_1.AZ nodes.
Coal Plants under economic Stress
Worsening utilization for coal plants
In addition, federal and state governments are pursuing aggressive decarbonization policies to reduce greenhouse gas emissions:
-
About half of US states have committed to greenhouse gas emissions reduction goals.
-
Over 170 cities have committed to 100% clean, renewable energy.
However, recovery of recent investments in major emissions control equipment to comply with various environmental laws pose a major obstacle to early retirements.
3
Recent undepreciated investments in environmental control equipment pose major obstacle to early retirements of utility-owned coal plants
Between 2010–2019, 77 GW of regulated coals plants were equipped with capital-intensive environmental control technologies to comply with various environmental laws. For example, 38.1 GW of coal capacity installed Selective Catalytic Reduction equipment, costing around $492/kW on average.
If retired early, such a plant may be subject to cost recovery risks because investment decisions were made based on the plant’s remaining full lifetime. Across the country, unrecovered coal investments amount to over $100 billion.
However, over the past decade, utilities successfully proposed to recover more than $5 billion of undepreciated costs through existing regulatory tools (such as regulatory asset and accelerated depreciation) as well as the repurposed securitization mechanism.
Coal Capacity (MW)
0
100-900
1000-2400
2500-4900
5000+
Figure 9: Capacity of IOU-owned Coal Plants with major investments in environmental control equipment.
Sources and Notes: Brattle’s analysis based on data from Velocity Suite, ABB Inc.

Click States to Explore
Treatment
Regulatory Asset
Securitization
Both
Figure 10: REGULATORY TREATMENT OF UNDEPRECIATED PAST INVESTMENT COSTS AT RETIRING COAL PLANTS.
Sources and Notes: Brattle

Oregon
Retiring Coal Plants
Boardman
Past Costs Recovered
$14 Million
Idaho
Retiring Coal Plants
Boardman, Carbon, North Valmy
Past Costs Recovered
$166 Million
Nevada
Retiring Coal Plants
Reid Gardner, Navajo
Past Costs Recovered
$277 Million
Colorado
Retiring Coal Plants
Cameo, Arapahoe, Zuni, Comanche
Past Costs Recovered
$247 Million
New Mexico
Retiring Coal Plants
San Juan
Past Costs Recovered
$477 Million
North Dakota
Retiring Coal Plants
RM Heskett, Lewis&Clark
Past Costs Recovered
$87 Million
South Dakota
Retiring Coal Plants
Neil Simpson, Osage, Ben French
Past Costs Recovered
$87 Million
Kansas
Retiring Coal Plants
Tecumseh Energy Center
Past Costs Recovered
$28 Million
Texas
Retiring Coal Plants
Oklaunion
Past Costs Recovered
$49 Million
Minnesota
Retiring Coal Plants
Hoot Lake, Clay Boswell
Past Costs Recovered
$50 Million
Missouri
Retiring Coal Plants
Sibley
Past Costs Recovered
$146 Million
Wisconsin
Retiring Coal Plants
Pulliam, Nelson Dewey, Edgewater, Pleasant Prairie, Presque Isle
Past Costs Recovered
$664 Million
Michigan
Retiring Coal Plants
D.E. Karn
Past Costs Recovered
$779 Million
Indiana
Retiring Coal Plants
Gibson
Past Costs Recovered
$25 Million
Kentucky
Retiring Coal Plants
Big Sandy
Past Costs Recovered
$135 Million
Virginia
Retiring Coal Plants
Chesterfield
Past Costs Recovered
$107 Million
North Carolina
Retiring Coal Plants
Asheville
Past Costs Recovered
$232 Million
Georgia
Retiring Coal Plants
Plant Branch, Hammond
Past Costs Recovered
$781 Million
Alabama
Retiring Coal Plants
Gorgas
Past Costs Recovered
$740 Million
Florida
Retiring Coal Plants
Plant Smith, St. Johns River Power Park
Past Costs Recovered
$345 Million
Plants that installed major control equipment
recent regulatory treatment for coal retirements
about brattle
The Brattle Group answers complex economic, finance, and regulatory questions for corporations, law firms, and governments around the world. We are distinguished by the clarity of our insights and the credibility of our experts, which include leading international academics and industry specialists. Brattle has 500 talented professionals across North America, Europe, and Asia-Pacific.


Metin Celebi
Principal
Frank Graves
Principal
Robert Mudge
Principal
Long Lam
Senior Associate
authors
4
Retirements have reduced coal capacity, but remaining capacity will exceed what 2035 emissions targets require
Brattle has deep expertise in guiding utilities and industry stakeholders through the complex decision process and regulatory landscape related to coal plants.
Assess economics of coal plant retirement
Evaluate replacement resources and analyze system reliability impacts
Analyze the trade-offs of different recovery mechanisms
Provide regulatory support for recovery of past investments
ASSESS ECONOMICS OF COAL PLANT RETIREMENTS
Brattle experts have supported a number of utilities to model and evaluate the economics of coal plant retirements based on key market fundamentals and plant-specific factors.
For Wisconsin Power & Light, Brattle experts developed analysis and reviewed system modeling results related to the decision to retire the utility’s Edgewater 5 ahead of previous schedule. We showed that retiring the plant and replacing it with renewable energy resources would lead to significant savings for customers.
For another utility, Brattle experts reviewed system modeling results, conducted unit-specific analyses of potential savings and costs, and provided recommendations for the company’s coal plants.
EVALUATE REPLACEMENT RESOURCES AND ANALYZE SYSTEM RELIABILITY IMPACTS
To comply with new clean energy law, the Public Service Company of New Mexico (PNM) proposed to abandon its 497 MW share of the San Juan Generating Station (SJGS) and replace it with renewables plus storage and some gas-fired peaking resources.
Brattle helped PNM demonstrate the prudency of the utility’s proposed plan, showing that the expected cost savings and risk reductions associated with the plan outweighed the option – suggested by Commission staff – of retrofitting the plan with carbon capture, utilization, and storage.
The New Mexico Public Regulation Commission ruled in favor of PNM, allowing the utility to abandon SJGS and to securitize up to $360.1 million of unrecovered investments and adjustment costs.
See Frank Graves’ testimony on PNM’s San Juan Generating Station
ANALYZE THE TRADE-OFFS OF DIFFERENT RECOVERY MECHANISMS
Traditional recovery mechanisms include regulatory asset, accelerated depreciation, and levelization. More recently, securitization has emerged as a useful tool for full recovery at low cost to customers.
Securitization raises new funds for redeployment and avoids return on equity and taxes. The mechanism is amenable to flexible structuring (such as levelization shown below).
For Pacific Gas and Electric Company, Brattle experts provided analytical support for the utility’s application to issue securitization bonds to refund the company’s payment of wildfire claims from 2017, with resulting improvements in PG&E’s credit metrics. PG&E’s application was approved by the California Public Utilities Commission in April 2021.

PROVIDE REGULATORY SUPPORT FOR RECOVERY OF PAST INVESTMENTS
Brattle experts opined on the appropriateness of The Empire District Electric Company continuing to recover the remaining net book value at Asbury coal plant as a regulatory asset.
We evaluated the prudency of past major capital investment decisions based on the then-projected cost savings relative to retirement. We also opined on the nature of asymmetric risks faced by regulated utilities and their role in determining the appropriateness of recovery of prudently incurred costs.
Brattle experts regularly review and opine on the prudency of past investments and the decision to retire coal assets. We also comment on the appropriateness of recovering prudently incurred costs, especially in the context of stakeholders arguing for less than full cost recovery through used and useful, risk sharing, and fairness arguments.